Advanced Monitoring: Extended Events & DMVs
Prerequisites: Understanding of SQL Server fundamentals. See DB 05 Performance Tuning.
Move beyond SQL Profiler to enterprise-grade monitoring with Extended Events and Dynamic Management Views.
Part A: Extended Events (XEvents)
1. What are Extended Events?
Extended Events is SQL Server’s lightweight, high-performance event-tracking system - replacement for SQL Trace/Profiler.
graph LR
    subgraph "SQL Profiler (Old)"
        P1[Heavy overhead]
        P2[Deprecated]
    end

    subgraph "Extended Events (New)"
        X1[Lightweight]
        X2[Configurable targets]
        X3[Production-safe]
    end

    style P1 fill:#e74c3c,color:#fff
    style X1 fill:#27ae60,color:#fff
2. XE Architecture
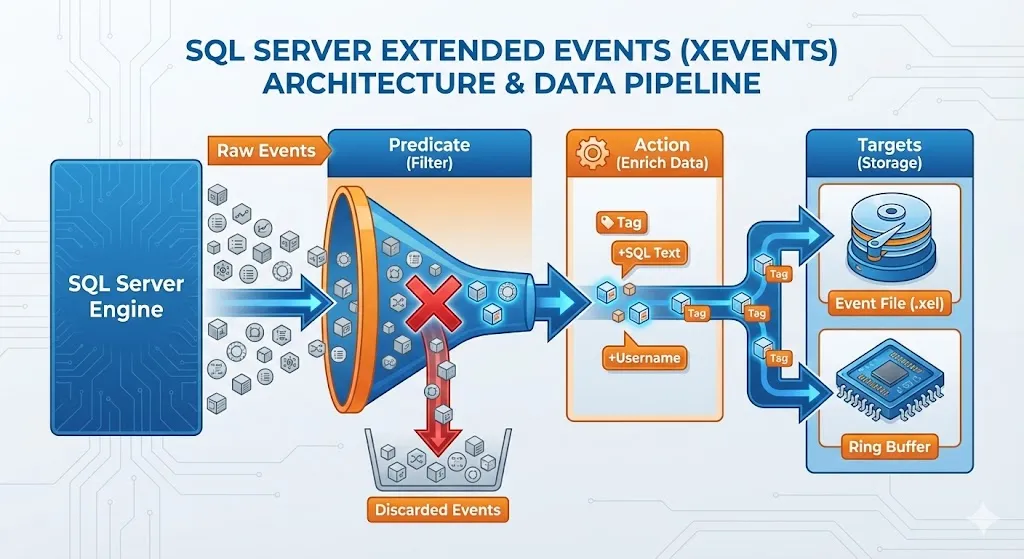
| Component | Description |
|---|---|
| Events | What happens (query completion, error, etc.) |
| Actions | Additional data to collect (query text, session ID) |
| Targets | Where data goes (file, ring buffer, histogram) |
| Predicates | Filters (only events matching criteria) |
Beginner Tip: Use SSMS GUI
The T-SQL syntax can be intimidating. In SSMS, right-click Management → Extended Events → Sessions → New Session Wizard to create sessions visually, then script them out to learn the syntax.
3. Creating an Extended Events Session
-- Track slow queries (> 1 second)
CREATE EVENT SESSION [SlowQueries]
ON SERVER
ADD EVENT sqlserver.sql_statement_completed (
    ACTION (
        sqlserver.sql_text,
        sqlserver.database_name,
        sqlserver.username,
        sqlserver.client_hostname
    )
    WHERE duration > 1000000  -- microseconds = 1 second
)
ADD TARGET package0.event_file (
    SET filename = N'C:\XEvents\SlowQueries.xel',
        max_file_size = 100  -- MB
)
WITH (
    MAX_MEMORY = 4096 KB,
    EVENT_RETENTION_MODE = ALLOW_SINGLE_EVENT_LOSS,
    MAX_DISPATCH_LATENCY = 30 SECONDS,
    STARTUP_STATE = ON
);

-- Start the session
ALTER EVENT SESSION [SlowQueries] ON SERVER STATE = START;
4. Common Event Sessions
Track Deadlocks
CREATE EVENT SESSION [Deadlocks]
ON SERVER
ADD EVENT sqlserver.xml_deadlock_report
ADD TARGET package0.event_file (
    SET filename = N'C:\XEvents\Deadlocks.xel'
)
WITH (STARTUP_STATE = ON);
Track Long-Running Queries
CREATE EVENT SESSION [LongQueries]
ON SERVER
ADD EVENT sqlserver.sql_batch_completed (
    ACTION (sqlserver.sql_text, sqlserver.database_name)
    WHERE duration > 30000000  -- 30 seconds
)
ADD TARGET package0.ring_buffer
WITH (MAX_MEMORY = 8192 KB);
Ring Buffer Warning
Ring Buffer stores data as XML. For high-volume events, parsing this XML with T-SQL is very slow and CPU-intensive. In production, prefer
event_filetarget instead.
Track Login Failures
CREATE EVENT SESSION [FailedLogins]
ON SERVER
ADD EVENT sqlserver.error_reported (
    ACTION (sqlserver.client_hostname, sqlserver.username)
    WHERE error_number = 18456  -- Login failed
)
ADD TARGET package0.event_file (
    SET filename = N'C:\XEvents\FailedLogins.xel'
);
5. Reading Extended Events Data
-- Read from file target
SELECT
    event_data.value('(@timestamp)[1]', 'datetime2') AS event_time,
    event_data.value('(data[@name="duration"]/value)[1]', 'bigint') / 1000000.0 AS duration_sec,
    event_data.value('(action[@name="sql_text"]/value)[1]', 'nvarchar(max)') AS sql_text,
    event_data.value('(action[@name="database_name"]/value)[1]', 'nvarchar(128)') AS database_name
FROM (
    SELECT CAST(event_data AS XML) AS event_data
    FROM sys.fn_xe_file_target_read_file('C:\XEvents\SlowQueries*.xel', NULL, NULL, NULL)
) AS events;
Part B: Dynamic Management Views (DMVs)
6. What are DMVs?
DMVs are system views that expose internal SQL Server health and performance data.
Critical: DMVs are Memory-Resident
DMV data is stored in memory and resets to zero when SQL Server restarts. For example,
sys.dm_db_index_usage_statswill show zero usage for all indexes right after a restart — this doesn’t mean indexes are unused!
graph TD
    subgraph "DMV Categories"
        EXEC[Execution: dm_exec_*<br/>Queries, Plans, Connections]
        OS[OS: dm_os_*<br/>Memory, Waits, Schedulers]
        DB[Database: dm_db_*<br/>Indexes, Stats, Files]
        IO[I/O: dm_io_*<br/>Disk, Virtual Files]
    end
7. Essential DMVs
| DMV | Purpose |
|---|---|
sys.dm_exec_requests | Currently executing queries |
sys.dm_exec_query_stats | Aggregated query statistics |
sys.dm_os_wait_stats | Server-wide wait statistics |
sys.dm_db_index_usage_stats | Index usage since restart |
sys.dm_exec_connections | Active connections |
sys.dm_os_performance_counters | Performance counter values |
8. Most Useful DMV Queries
Currently Running Queries
SELECT
    r.session_id,
    r.status,
    r.command,
    r.wait_type,
    r.wait_time / 1000.0 AS wait_sec,
    r.blocking_session_id,
    r.cpu_time,
    r.total_elapsed_time / 1000.0 AS elapsed_sec,
    t.text AS query_text,
    DB_NAME(r.database_id) AS database_name
FROM sys.dm_exec_requests r
CROSS APPLY sys.dm_exec_sql_text(r.sql_handle) t
WHERE r.session_id > 50  -- Exclude system sessions
ORDER BY r.total_elapsed_time DESC;
Top CPU-Consuming Queries
SELECT TOP 20
    qs.total_worker_time / 1000000.0 AS total_cpu_sec,
    qs.execution_count,
    qs.total_worker_time / qs.execution_count / 1000.0 AS avg_cpu_ms,
    SUBSTRING(st.text, (qs.statement_start_offset/2)+1,
        ((CASE qs.statement_end_offset
            WHEN -1 THEN DATALENGTH(st.text)
            ELSE qs.statement_end_offset
        END - qs.statement_start_offset)/2)+1) AS statement_text
FROM sys.dm_exec_query_stats qs
CROSS APPLY sys.dm_exec_sql_text(qs.sql_handle) st
ORDER BY qs.total_worker_time DESC;
Wait Statistics
SELECT TOP 10
    wait_type,
    waiting_tasks_count,
    wait_time_ms / 1000.0 AS wait_sec,
    wait_time_ms / NULLIF(waiting_tasks_count, 0) AS avg_wait_ms
FROM sys.dm_os_wait_stats
WHERE wait_type NOT IN (
    'SLEEP_TASK', 'BROKER_TO_FLUSH', 'SQLTRACE_BUFFER_FLUSH',
    'CLR_AUTO_EVENT', 'CLR_MANUAL_EVENT', 'LAZYWRITER_SLEEP',
    'REQUEST_FOR_DEADLOCK_SEARCH', 'WAITFOR', 'XE_TIMER_EVENT'
)
AND wait_time_ms > 0
ORDER BY wait_time_ms DESC;
Index Usage Statistics
SELECT
    OBJECT_NAME(i.object_id) AS table_name,
    i.name AS index_name,
    ius.user_seeks,
    ius.user_scans,
    ius.user_lookups,
    ius.user_updates
FROM sys.indexes i
JOIN sys.dm_db_index_usage_stats ius
    ON i.object_id = ius.object_id AND i.index_id = ius.index_id
WHERE OBJECTPROPERTY(i.object_id, 'IsUserTable') = 1
ORDER BY ius.user_updates DESC;
Missing Indexes
SELECT TOP 20
    DB_NAME(d.database_id) AS database_name,
    OBJECT_NAME(d.object_id, d.database_id) AS table_name,
    d.equality_columns,
    d.inequality_columns,
    d.included_columns,
    s.avg_user_impact,
    s.user_seeks + s.user_scans AS total_reads,
    'CREATE INDEX IX_' + OBJECT_NAME(d.object_id, d.database_id) + '_Missing
     ON ' + QUOTENAME(OBJECT_SCHEMA_NAME(d.object_id, d.database_id)) + '.'
          + QUOTENAME(OBJECT_NAME(d.object_id, d.database_id))
     + ' (' + ISNULL(d.equality_columns, '')
     + CASE WHEN d.inequality_columns IS NOT NULL
            THEN ', ' + d.inequality_columns ELSE '' END + ')' AS create_statement
FROM sys.dm_db_missing_index_details d
JOIN sys.dm_db_missing_index_groups g ON d.index_handle = g.index_handle
JOIN sys.dm_db_missing_index_group_stats s ON g.index_group_handle = s.group_handle
ORDER BY s.avg_total_user_cost * s.avg_user_impact * (s.user_seeks + s.user_scans) DESC;
Missing Index Disclaimer
These suggestions are “greedy” — they optimize for reads without considering write overhead or similar existing indexes. Always test before creating. Review
user_updatesto assess write penalty.
Part C: Proactive Monitoring
9. Key Metrics to Monitor
| Metric | Warning | Critical | DMV/Counter |
|---|---|---|---|
| CPU Usage | > 70% | > 90% | Performance counters |
| Buffer Cache Hit | < 95% | < 90% | Performance counters |
| Page Life Expectancy | < 300 | < 180 | Performance counters |
| Blocking Time | > 10 sec | > 30 sec | dm_exec_requests |
| Log File Usage | > 70% | > 90% | DBCC SQLPERF |
| Active Connections | > 80% max | > 90% max | dm_exec_connections |
10. Monitoring Dashboard Query
-- Quick health check
SELECT
    -- CPU
    (SELECT TOP 1 cntr_value FROM sys.dm_os_performance_counters
     WHERE counter_name = 'CPU usage %') AS cpu_pct,

    -- Page Life Expectancy
    (SELECT cntr_value FROM sys.dm_os_performance_counters
     WHERE counter_name = 'Page life expectancy' AND object_name LIKE '%Buffer Manager%') AS ple,

    -- Active Sessions
    (SELECT COUNT(*) FROM sys.dm_exec_sessions WHERE is_user_process = 1) AS user_sessions,

    -- Blocking Chains
    (SELECT COUNT(*) FROM sys.dm_exec_requests WHERE blocking_session_id > 0) AS blocked_requests,

    -- Long Queries (> 30 sec)
    (SELECT COUNT(*) FROM sys.dm_exec_requests
     WHERE total_elapsed_time > 30000 AND session_id > 50) AS long_queries;
11. Setting Up Alerts
-- Enable Database Mail first, then:
EXEC msdb.dbo.sp_add_alert
    @name = N'High CPU Alert',
    @message_id = 0,
    @severity = 0,
    @enabled = 1,
    @delay_between_responses = 300,
    @performance_condition = N'SQLServer:Resource Pool Stats|CPU usage %|default|>|80',
    @job_id = N'00000000-0000-0000-0000-000000000000';

-- Send notification
EXEC msdb.dbo.sp_add_notification
    @alert_name = N'High CPU Alert',
    @operator_name = N'DBA Team',
    @notification_method = 1;  -- Email
Summary
Extended Events vs SQL Trace
| Aspect | SQL Trace | Extended Events |
|---|---|---|
| Overhead | High | Low |
| Production use | ✗ Risky | ✓ Safe |
| Targets | File only | File, ring buffer, histogram |
| Filtering | Limited | Predicates |
| Status | Deprecated | Current |
Essential DMVs Cheat Sheet
| Need | DMV |
|---|---|
| Running queries | sys.dm_exec_requests |
| Historical query stats | sys.dm_exec_query_stats |
| Wait analysis | sys.dm_os_wait_stats |
| Index usage | sys.dm_db_index_usage_stats |
| Missing indexes | sys.dm_db_missing_index_details |
| Memory | sys.dm_os_buffer_descriptors |
| Connections | sys.dm_exec_connections |
Monitoring Best Practices
- Use Extended Events → Profiler is deprecated
- Baseline your DMVs → Know what “normal” looks like
- Schedule DMV snapshots → Track trends over time
- Alert proactively → Don’t wait for users to complain
- Query Store + XEvents → Complete visibility
Practice Questions
Conceptual
-
Why are Extended Events preferred over SQL Profiler?
-
What is the difference between DMV dm_exec_requests vs dm_exec_query_stats?
-
Explain what Page Life Expectancy measures and why it matters.
Hands-on
-- Write an Extended Events session to capture all queries that:
-- 1. Take longer than 5 seconds
-- 2. Include the SQL text and database name
-- 3. Save to a file target
View Answer
CREATE EVENT SESSION [LongQueries5Sec]
ON SERVER
ADD EVENT sqlserver.sql_statement_completed (
    ACTION (sqlserver.sql_text, sqlserver.database_name)
    WHERE duration > 5000000  -- 5 seconds in microseconds
)
ADD TARGET package0.event_file (
    SET filename = N'C:\XEvents\LongQueries5Sec.xel'
)
WITH (STARTUP_STATE = ON);

ALTER EVENT SESSION [LongQueries5Sec] ON SERVER STATE = START;
Scenario
- Troubleshooting: Users report the application is slow. How would you use DMVs to quickly identify the cause?