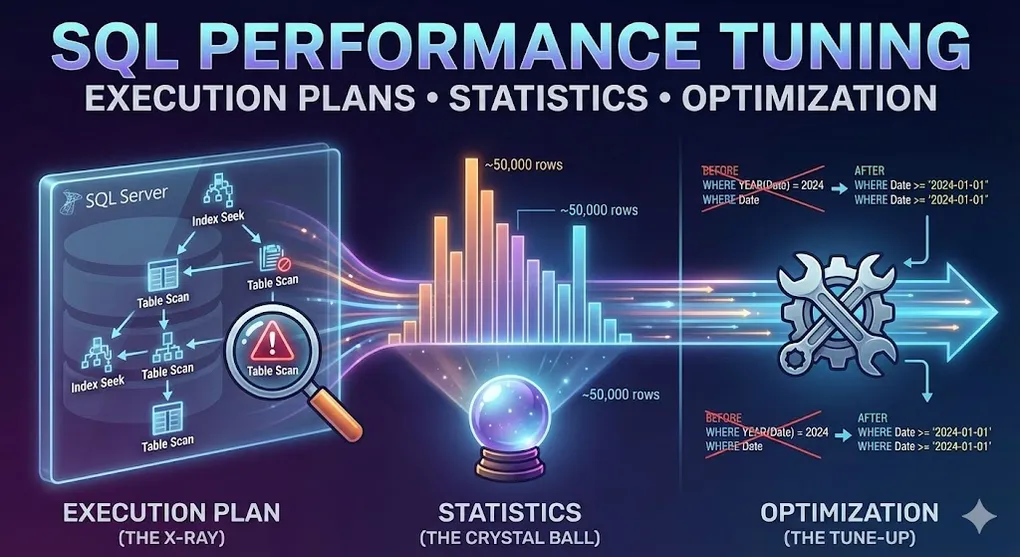
SQL Performance Tuning: Execution Plans, Statistics & Optimization
Prerequisites: Understand B-Tree indexes. See DB 03 B-Tree Index.
Your query works, but it’s slow. This article teaches you to find and fix performance bottlenecks.
Part A: Execution Plans — The SQL Server X-Ray
1. What is an Execution Plan?
When you run a query, SQL Server creates a plan showing HOW it will execute:
graph LR
    Q[Your Query] --> QO[Query Optimizer]
    QO --> EP[Execution Plan]
    EP --> E[Execute]
    E --> R[Results]

    style QO fill:#3498db,color:#fff
    style EP fill:#27ae60,color:#fff
2. How to View Execution Plans
| Method | Shortcut | Description |
|---|---|---|
| Estimated Plan | Ctrl+L | Shows plan WITHOUT running query |
| Actual Plan | Ctrl+M, then run | Shows plan WITH runtime stats |
| Live Query Stats | - | Real-time progress |
-- Or use SET commands:
SET SHOWPLAN_TEXT ON;
SET STATISTICS IO ON;
SET STATISTICS TIME ON;

SELECT * FROM Customers WHERE Country = 'Taiwan';
Understanding STATISTICS IO Output
-- Example output:
-- Table 'Customers'. Scan count 1, logical reads 125, physical reads 0| Metric | Meaning | What to Watch |
|---|---|---|
| Logical Reads | Pages read from memory (buffer pool) | 🔥 THIS is your key metric — reduce this! |
| Physical Reads | Pages read from disk | 0 is great (data was cached) |
| Scan Count | Number of times table was accessed | High = possible N+1 problem |
3. Reading the Execution Plan
Read from RIGHT to LEFT, BOTTOM to TOP.
┌─────────────────────────────────────────────────────────────────┐
│                     Execution Plan                              │
├─────────────────────────────────────────────────────────────────┤
│                                                                 │
│   SELECT ← Nested Loop ← Index Seek (Customers)                 │
│     │         │              │                                  │
│     │         │              └── Cost: 10%                      │
│     │         └── Cost: 30%                                     │
│     └── Cost: 60%                                               │
│                                                                 │
│   Data flows: Right → Left (arrows show direction)              │
│   Thicker arrow = More rows                                     │
│                                                                 │
└─────────────────────────────────────────────────────────────────┘
4. Key Operators to Know
| Operator | Icon | Meaning | Performance |
|---|---|---|---|
| Index Seek | 🎯 | Jump directly to data | ⚡ Fast |
| Index Scan | 📜 | Read entire index | 🐌 Slow |
| Table Scan | 📋 | Read entire table | 🐌🐌 Very slow |
| Key Lookup | 🔑 | Extra trip to table | ⚠️ Watch out |
| Nested Loop | ♻️ | For each row, find match | OK for small sets |
| Hash Match | #️⃣ | Build hash table | Good for large joins |
| Sort | 🔄 | Needs memory | Can spill to disk |
5. Warning Signs in Execution Plans
| Warning | Meaning | Fix |
|---|---|---|
| Yellow triangle ! | Plan issue detected | Check tooltip |
| Fat arrows | Many rows moving | Filter earlier |
| Table Scan | No useful index | Create index |
| Key Lookup (high %) | Missing covering index | Add INCLUDE columns |
| Sort (high %) | Missing ORDER BY index | Create sorted index |
Part B: Statistics — The Crystal Ball
6. What are Statistics?
SQL Server guesses how many rows a query will return using statistics.
┌─────────────────────────────────────────────────────────────────┐
│                     Statistics                                  │
├─────────────────────────────────────────────────────────────────┤
│                                                                 │
│   Column: Country                                               │
│   ┌────────────────┬──────────────┐                            │
│   │ Value          │ Row Count    │                            │
│   ├────────────────┼──────────────┤                            │
│   │ Taiwan         │ 50,000       │                            │
│   │ USA            │ 200,000      │                            │
│   │ Japan          │ 30,000       │                            │
│   └────────────────┴──────────────┘                            │
│                                                                 │
│   Query: WHERE Country = 'Taiwan'                               │
│   SQL Server estimates: ~50,000 rows                            │
│                                                                 │
└─────────────────────────────────────────────────────────────────┘
7. Why Statistics Matter
| Estimate | Reality | Consequence |
|---|---|---|
| 100 rows | 100 rows | ✅ Good plan |
| 100 rows | 1,000,000 rows | ❌ BAD plan! Wrong join strategy |
Stale statistics = Wrong estimates = Slow queries
The Tipping Point: When SQL Server Ignores Your Index
Even with a perfect index, SQL Server might choose a Table Scan. Why?
| Selectivity | SQL Server’s Choice | Reason |
|---|---|---|
| < 1% of rows | Index Seek + Key Lookup | Fast point lookups |
| 1-30% of rows | Index Seek + Key Lookup | Still worth the extra trip |
| > 30% of rows | Table Scan | Scan is actually faster! |
Tipping Point Formula:
If (Rows Selected / Total Rows) > ~25-33%
   → Table Scan beats Index Seek + Key Lookup

Why? Each Key Lookup requires a random I/O.
       Sequential scan of entire table is faster than
       thousands of random I/Os.
Common Confusion: “I created an index but SQL Server ignores it!” Check if your WHERE clause returns too many rows. That’s the Tipping Point in action.
8. Managing Statistics
-- View statistics:
DBCC SHOW_STATISTICS('Customers', 'IX_Country');

-- Update statistics for table:
UPDATE STATISTICS Customers;

-- Update all statistics in database:
EXEC sp_updatestats;

-- Auto-update setting:
ALTER DATABASE MyDB SET AUTO_UPDATE_STATISTICS ON;
Part C: Isolation Levels — Balancing Speed vs Accuracy
9. The Problem: Dirty Reads, Phantom Reads
| Problem | Description | Example |
|---|---|---|
| Dirty Read | Read uncommitted data | See $100 that gets rolled back |
| Non-Repeatable Read | Same query, different result | Balance was 50 |
| Phantom Read | New rows appear mid-query | COUNT was 10, now 11 |
10. Isolation Levels
SET TRANSACTION ISOLATION LEVEL READ UNCOMMITTED;
-- or
SELECT * FROM Accounts WITH (NOLOCK);| Level | Dirty Read | Non-Repeatable | Phantom | Lock Duration | Speed |
|---|---|---|---|---|---|
| READ UNCOMMITTED | ✅ Yes | ✅ Yes | ✅ Yes | None | ⚡⚡⚡ Fastest |
| READ COMMITTED | ❌ No | ✅ Yes | ✅ Yes | Short | ⚡⚡ Fast |
| REPEATABLE READ | ❌ No | ❌ No | ✅ Yes | Long | ⚡ Medium |
| SERIALIZABLE | ❌ No | ❌ No | ❌ No | Longest | 🐌 Slow |
| SNAPSHOT | ❌ No | ❌ No | ❌ No | Uses versioning | ⚡⚡ Fast |
11. When to Use What
| Scenario | Isolation Level |
|---|---|
| Dashboard / reporting (stale OK) | READ UNCOMMITTED |
| Normal OLTP | READ COMMITTED (default) |
| Financial calculations | SERIALIZABLE |
| High concurrency + accuracy | SNAPSHOT |
Part D: Query Hints — Manual Override
12. What are Query Hints?
When the optimizer makes wrong choices, hints force a specific behavior.
-- Force index usage:
SELECT * FROM Customers WITH (INDEX(IX_Country))
WHERE Country = 'Taiwan';

-- Force join type:
SELECT * FROM Orders o
INNER HASH JOIN Customers c ON o.CustomerID = c.CustomerID;

-- Force parallel execution:
SELECT * FROM BigTable OPTION (MAXDOP 4);
13. Common Hints
| Hint | Effect | Use When |
|---|---|---|
| NOLOCK | No shared locks | Reporting (dirty reads OK) |
| INDEX(name) | Force specific index | Optimizer picks wrong one |
| FORCESEEK | Force index seek | Optimizer uses scan |
| HASH/LOOP/MERGE JOIN | Force join type | Know better than optimizer |
| MAXDOP n | Limit parallelism | Control CPU usage |
| RECOMPILE | Fresh plan each time | Parameter sniffing issues |
14. Warning: Hints are Dangerous!
⚠️ Use hints as LAST RESORT only!

- Data changes → hint may become wrong
- Optimizer improves with SQL Server updates
- Hints prevent adaptation
Part E: Common Performance Killers
15. Anti-Patterns Checklist
| Problem | Detection | Solution |
|---|---|---|
| Missing Index | Table/Index Scan | Create appropriate index |
| Non-SARGable Query | Function on column in WHERE | Rewrite to be SARGable |
| Implicit Conversion | Yellow ⚠️ on SELECT operator | Match data types |
| **SELECT *** | Key Lookup high cost | Select only needed columns |
| Parameter Sniffing | Same query, different times | OPTION (RECOMPILE) |
| Too Many Indexes | Slow INSERT/UPDATE | Remove unused indexes |
16. SARGable: The #1 Performance Rule
SARGable = Search ARGument ABLE — can SQL Server use an index?
-- ❌ Non-SARGable (Index CANNOT be used)
WHERE YEAR(OrderDate) = 2024
WHERE UPPER(CustomerName) = 'JOHN'
WHERE Price + 10 > 100
WHERE LEFT(Phone, 3) = '886'

-- ✅ SARGable (Index CAN be used)
WHERE OrderDate >= '2024-01-01' AND OrderDate < '2025-01-01'
WHERE CustomerName = 'John'  -- (use case-insensitive collation)
WHERE Price > 90
WHERE Phone LIKE '886%'
The Golden Rule: Put the column ALONE on one side of the operator. If you wrap a column in a function, SQL Server must evaluate EVERY row.
17. Implicit Conversion: The Silent Killer
This is invisible in your code but devastating in the execution plan:
-- Column is VARCHAR, but you pass INT:
WHERE CustomerID = 12345  -- CustomerID is VARCHAR(10)

-- SQL Server secretly does:
WHERE CONVERT(INT, CustomerID) = 12345  -- Forces table scan!
How to spot it:
- Look for yellow warning triangle ⚠️ on the SELECT operator
- Hover to see: “Type conversion in expression… may affect ‘CardinalityEstimate‘“
| Your Code | Column Type | Problem | Fix |
|---|---|---|---|
WHERE ID = '123' | INT | Converts each row | WHERE ID = 123 |
WHERE Code = 100 | VARCHAR | Converts each row | WHERE Code = '100' |
WHERE Date = '2024-01-01' | DATETIME2 | Usually OK | — |
18. Parameter Sniffing Explained
-- First call with CustomerID = 1 (1 order)
EXEC GetOrders @CustomerID = 1;  -- Plan cached for "few rows"

-- Second call with CustomerID = 999 (1,000,000 orders)
EXEC GetOrders @CustomerID = 999;  -- Uses same "few rows" plan = SLOW!
Solutions:
-- 1. Recompile each time (CPU cost):
CREATE PROCEDURE GetOrders @CustomerID INT
WITH RECOMPILE
AS ...

-- 2. Optimize for unknown:
OPTION (OPTIMIZE FOR UNKNOWN);

-- 3. Use local variables:
DECLARE @LocalID INT = @CustomerID;
SELECT * FROM Orders WHERE CustomerID = @LocalID;
Summary: Performance Tuning Checklist
Execution Plan Red Flags
| Flag | Action |
|---|---|
| Table Scan | Create index |
| Key Lookup > 10% | Add INCLUDE columns |
| Sort > 20% | Create sorted index |
| Hash Match + spill | Add memory or simplify |
Quick Wins
- Check indexes — Missing? Fragmented? Unused?
- Update statistics — Stale = wrong plans
- **Avoid SELECT *** — Fetch only needed columns
- Watch data types — Implicit conversion kills indexes
Tools
| Tool | Purpose |
|---|---|
| Execution Plan | See how query runs |
| STATISTICS IO | Count page reads |
| sys.dm_exec_query_stats | Find expensive queries |
| Query Store | Historical query performance |
💡 Practice Questions
Conceptual
-
What is an execution plan and why is it important for performance tuning?
-
Explain what Table Scan vs Index Seek means. Which is better and why?
-
What are statistics in SQL Server and why do stale statistics cause performance issues?
-
Describe what parameter sniffing is and how it can cause performance problems.
Hands-on
-- Given this execution plan info: "Table Scan (Cost: 95%)"
-- What does this tell you? What would you do to fix it?

-- Write a query that intentionally prevents index usage due to a function on a column,
-- then rewrite it to allow index seek.
-- Bad: WHERE YEAR(OrderDate) = 2024
-- Good: ?
💡 View Answer
Table Scan Analysis:
- 95% cost = query is scanning the entire table
- No useful index exists for the WHERE clause
- Fix: Create an index on the filtered columns
Index-friendly rewrite:
-- BAD: Function on column prevents index usage
SELECT * FROM Orders WHERE YEAR(OrderDate) = 2024;

-- GOOD: Use range comparison (index can be used)
SELECT * FROM Orders
WHERE OrderDate >= '2024-01-01' AND OrderDate < '2025-01-01';
The key insight: Any function on a column (YEAR(), UPPER(), CONVERT()) prevents index seek. Rewrite to compare the column directly.
Scenario
- Investigation: A stored procedure ran fast (1 second) on Monday but now takes 30 seconds. The data hasn’t changed significantly. What are the top 3 things you would investigate?
💡 Scenario 1 Answer
Top 3 things to investigate:
-
Parameter Sniffing — Check if the plan was compiled with an atypical parameter value. Use
sp_recompileorOPTION(RECOMPILE)to test. -
Statistics — Were statistics updated over the weekend? Check
STATS_DATE()function. ConsiderUPDATE STATISTICSon involved tables. -
Blocking/Locking — Is another process locking the table? Check
sys.dm_exec_requestsforblocking_session_id > 0. A weekend batch job might still be running.
Bonus checks: Memory pressure (Page Life Expectancy), Plan cache eviction, Index fragmentation after bulk load.
- Trade-off: A report query uses NOLOCK hint for speed. Business says some numbers don’t match. Explain what’s happening and propose alternatives.