Projects
A collection of data analysis, dashboards, and technical experiments.
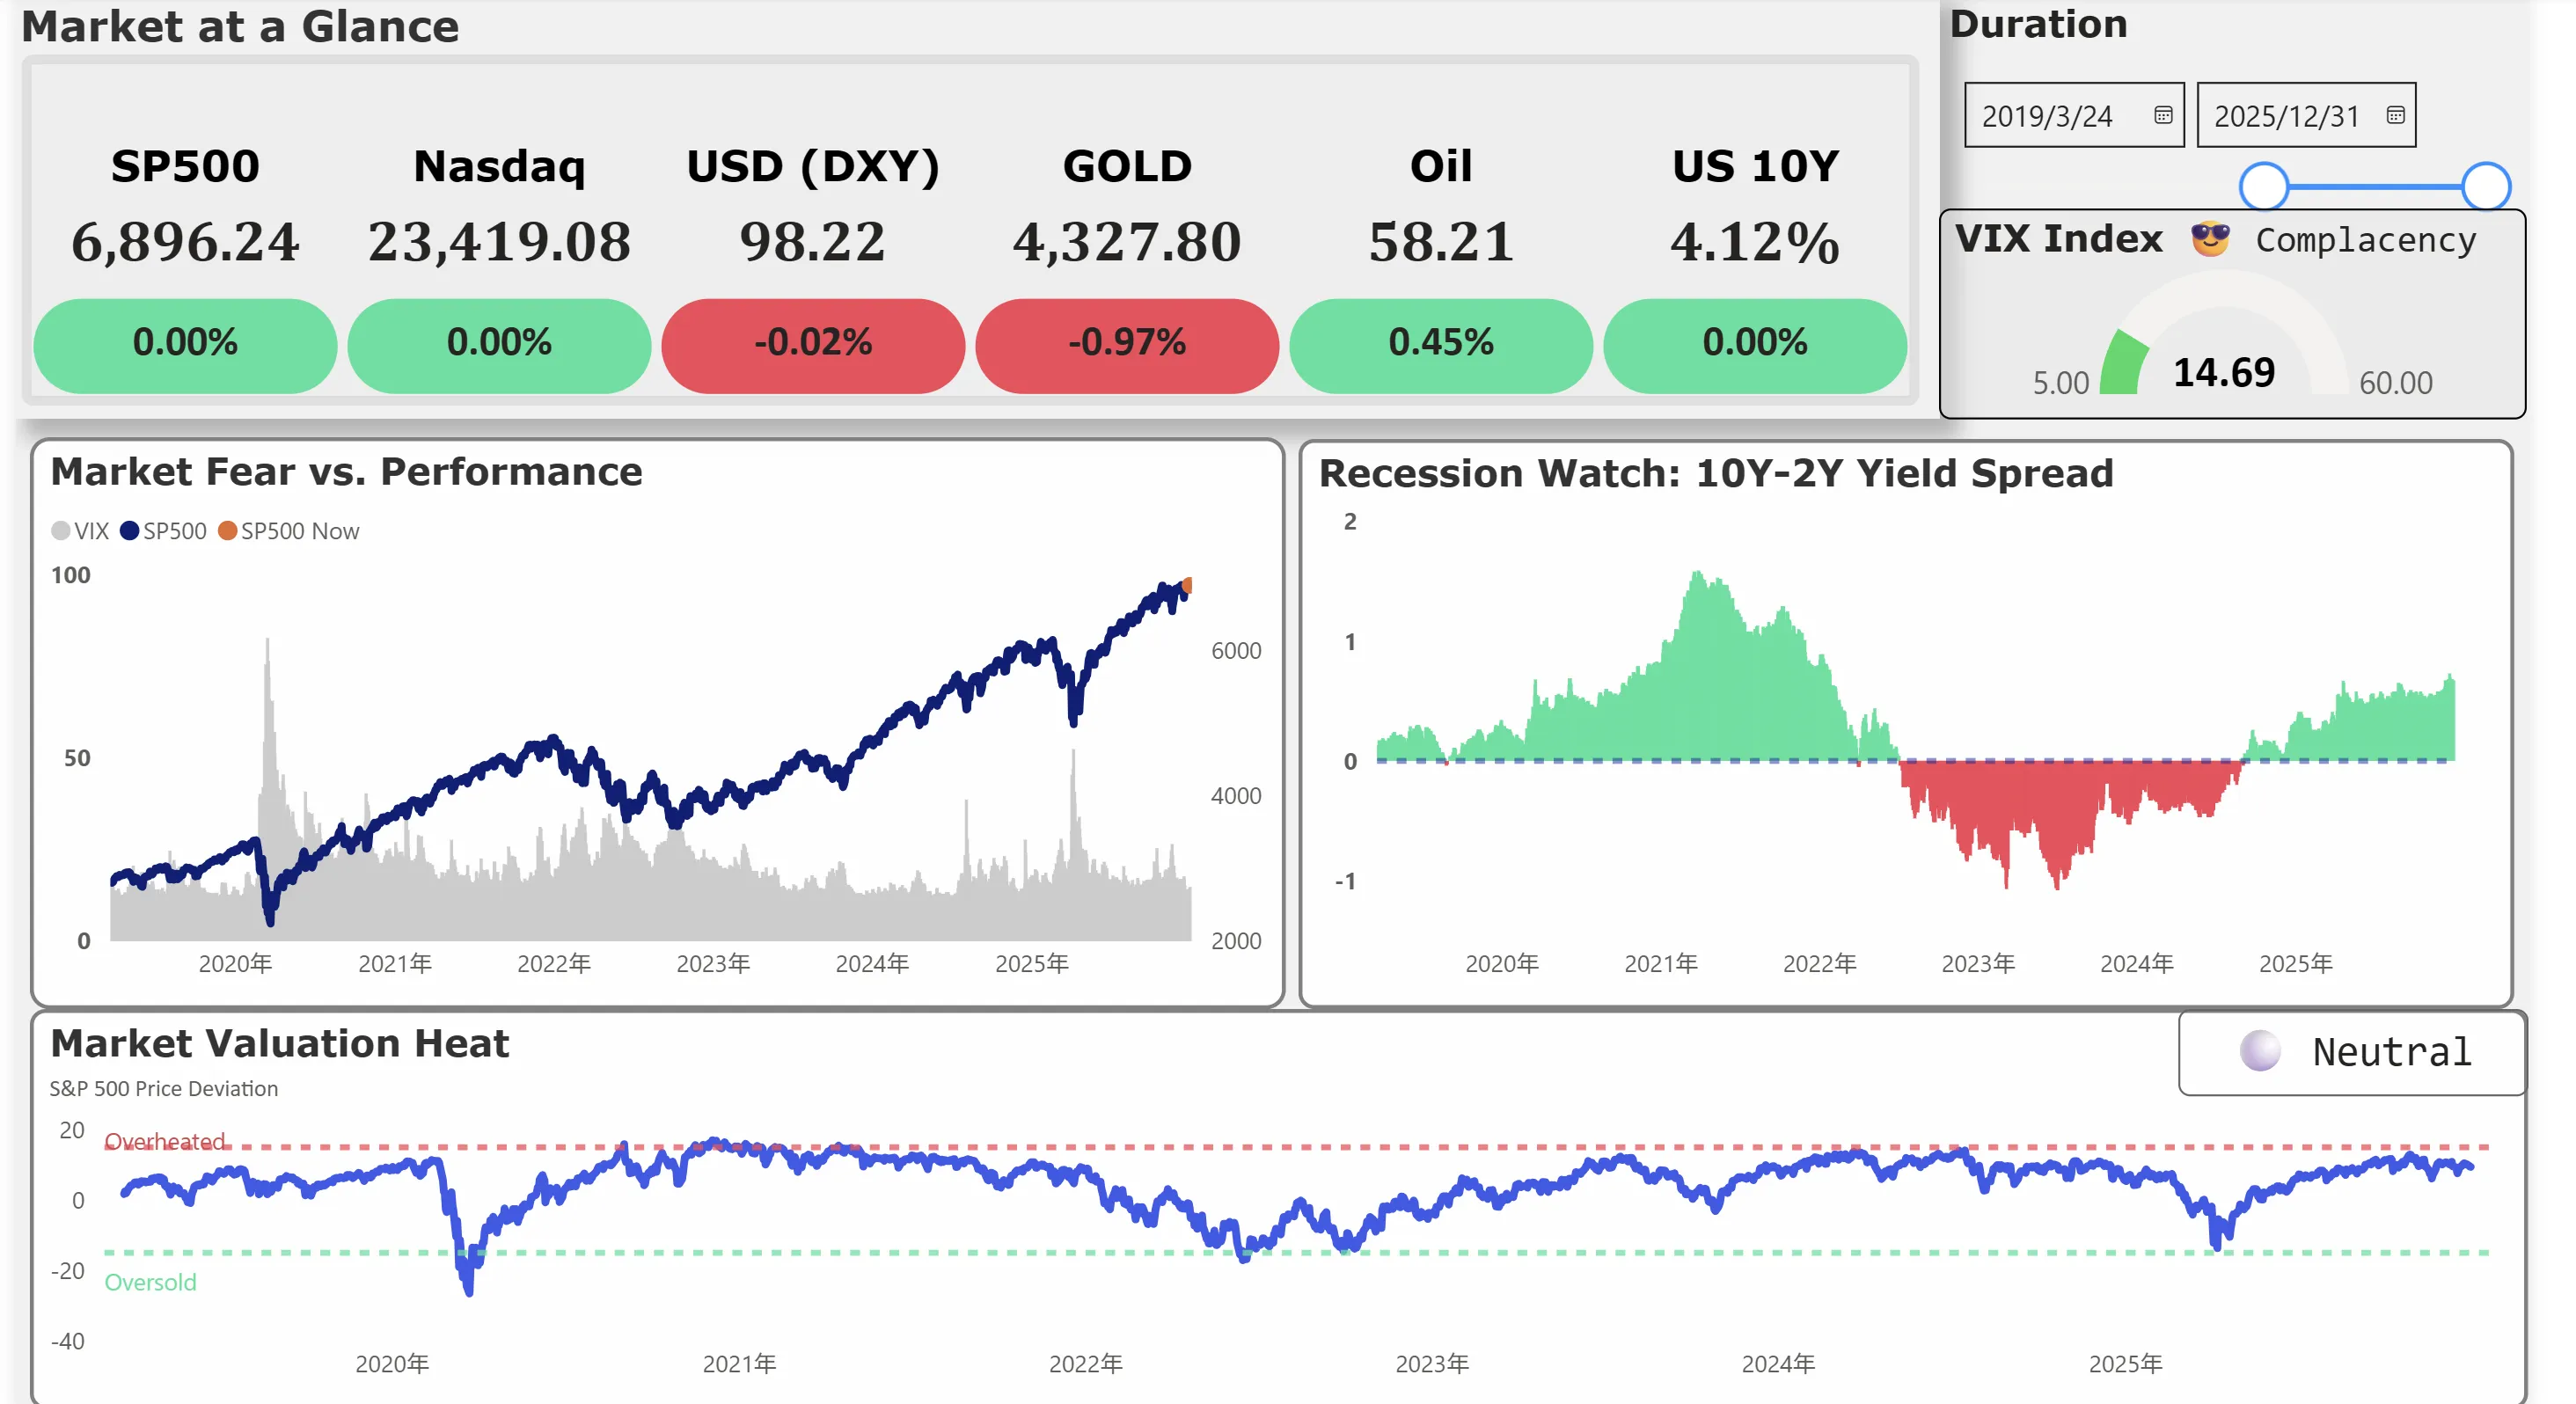
An end-to-end data pipeline and interactive dashboard designed to monitor economic health, Fed policy gaps, and market risks using Python and Power BI.
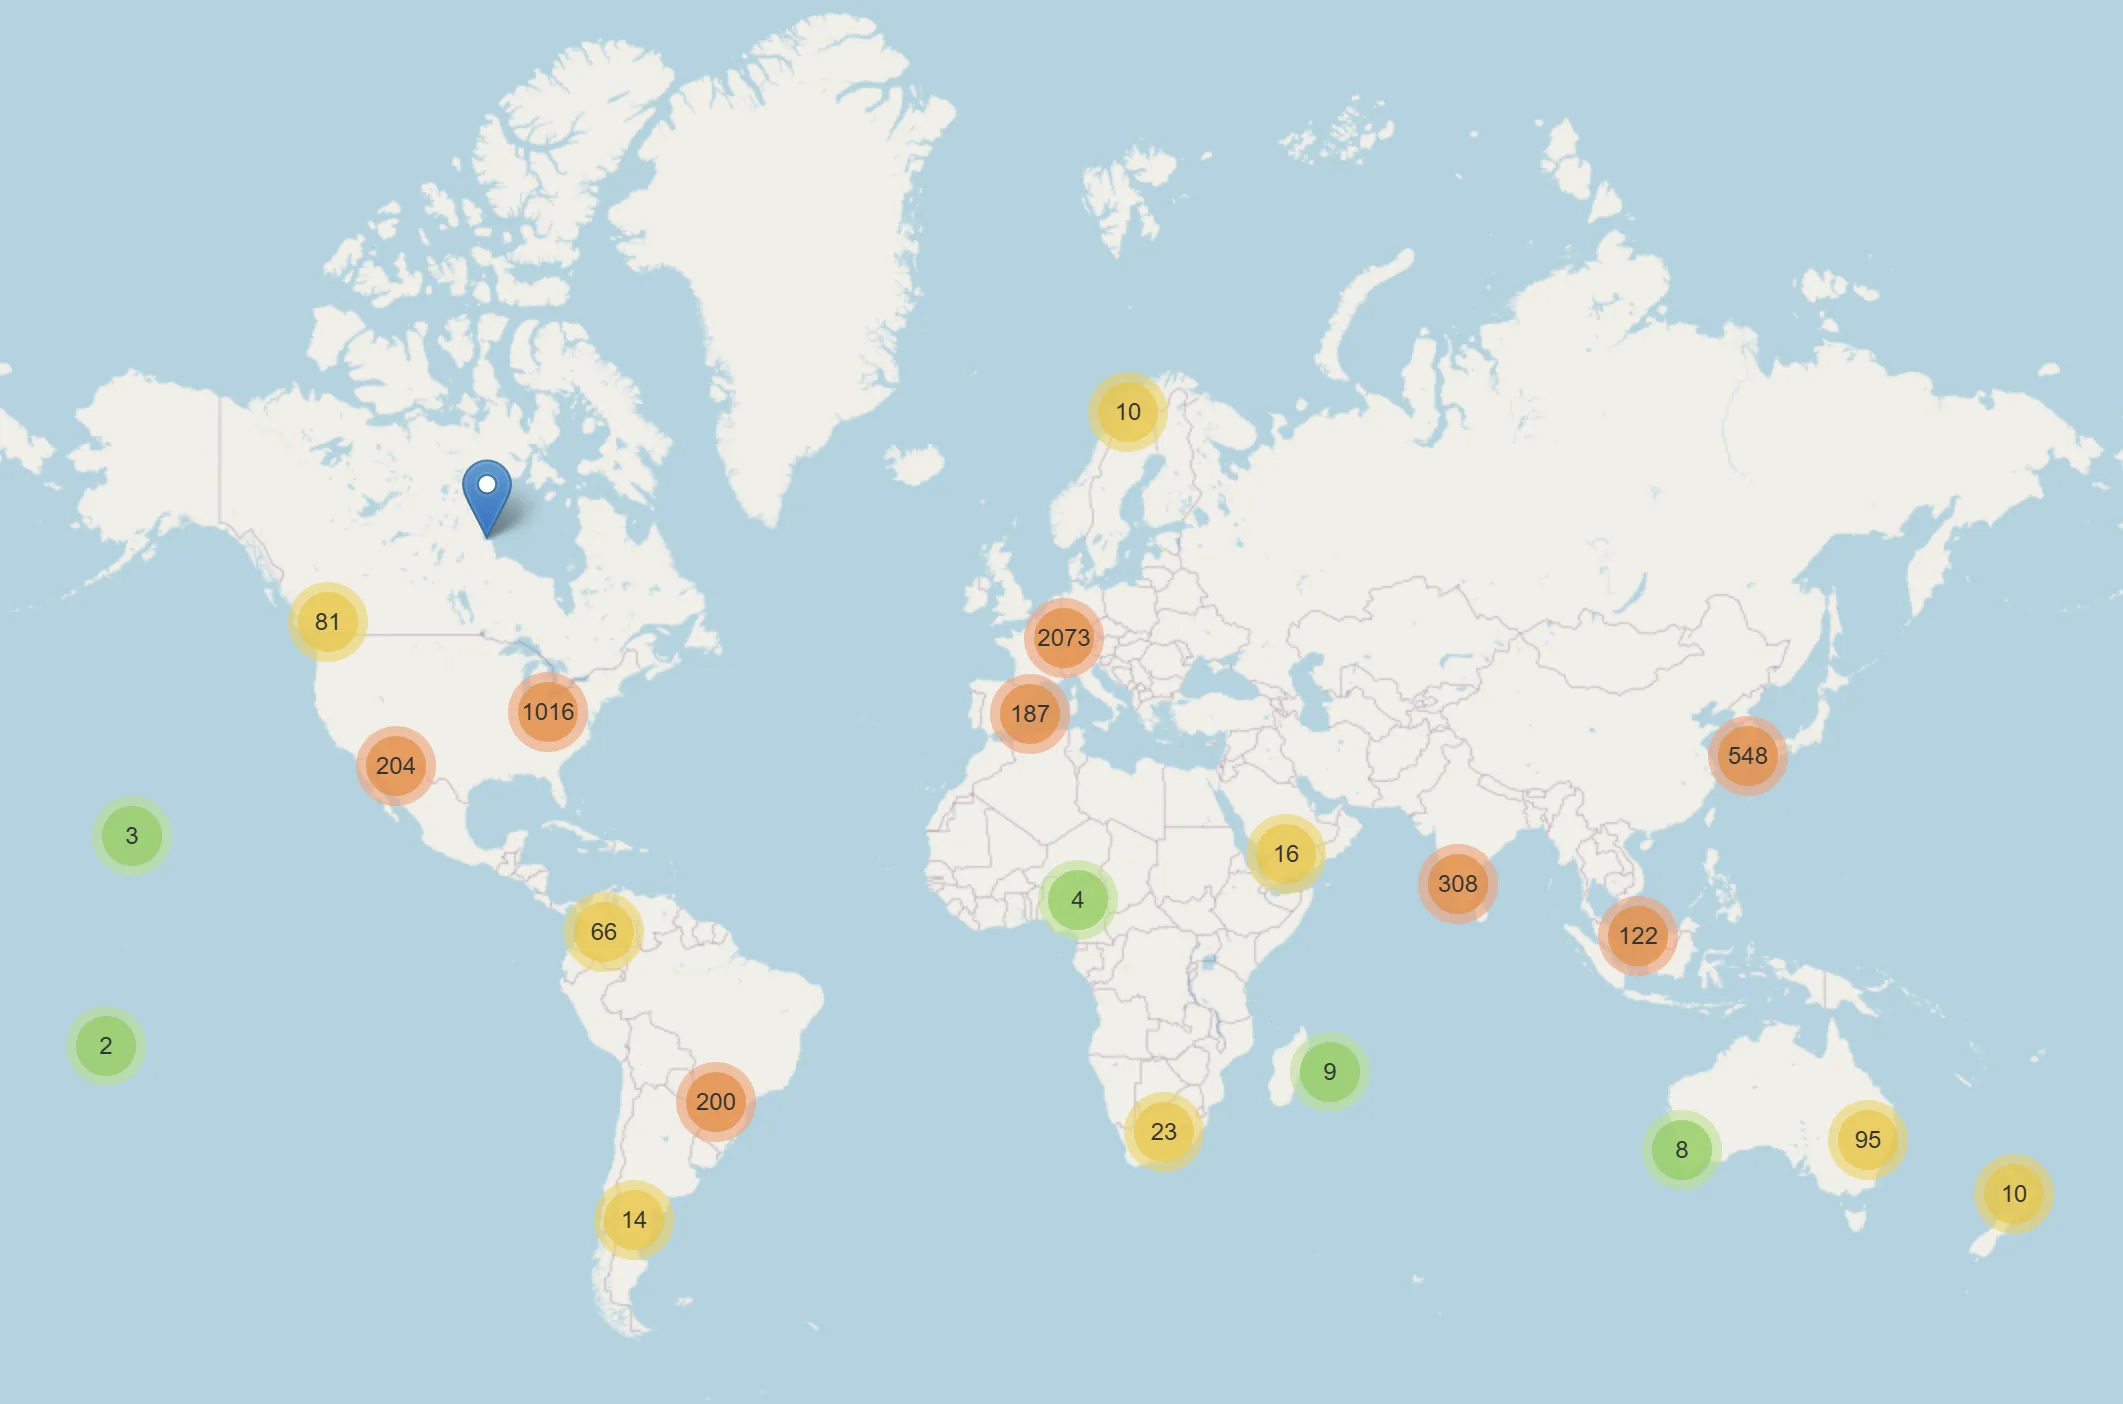
Engineered a fault-tolerant Python pipeline to map 80,000+ libraries globally, analyzing the correlation between public infrastructure, HDI, and innovation.
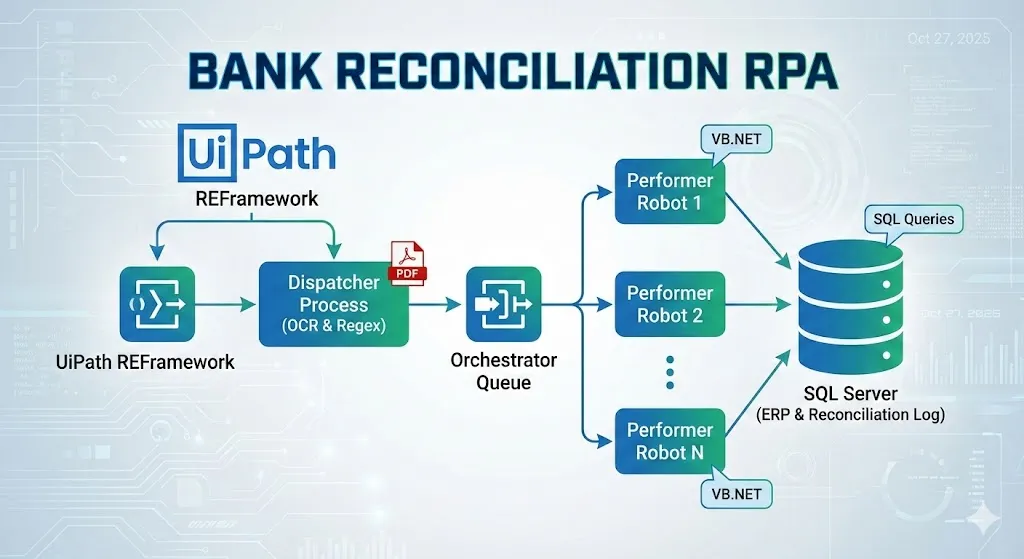
Enterprise RPA solution automating bank statement reconciliation using UiPath Orchestrator, Dispatcher-Performer pattern, OCR, and Regex—achieving 96% time reduction and 81.8% ROI.
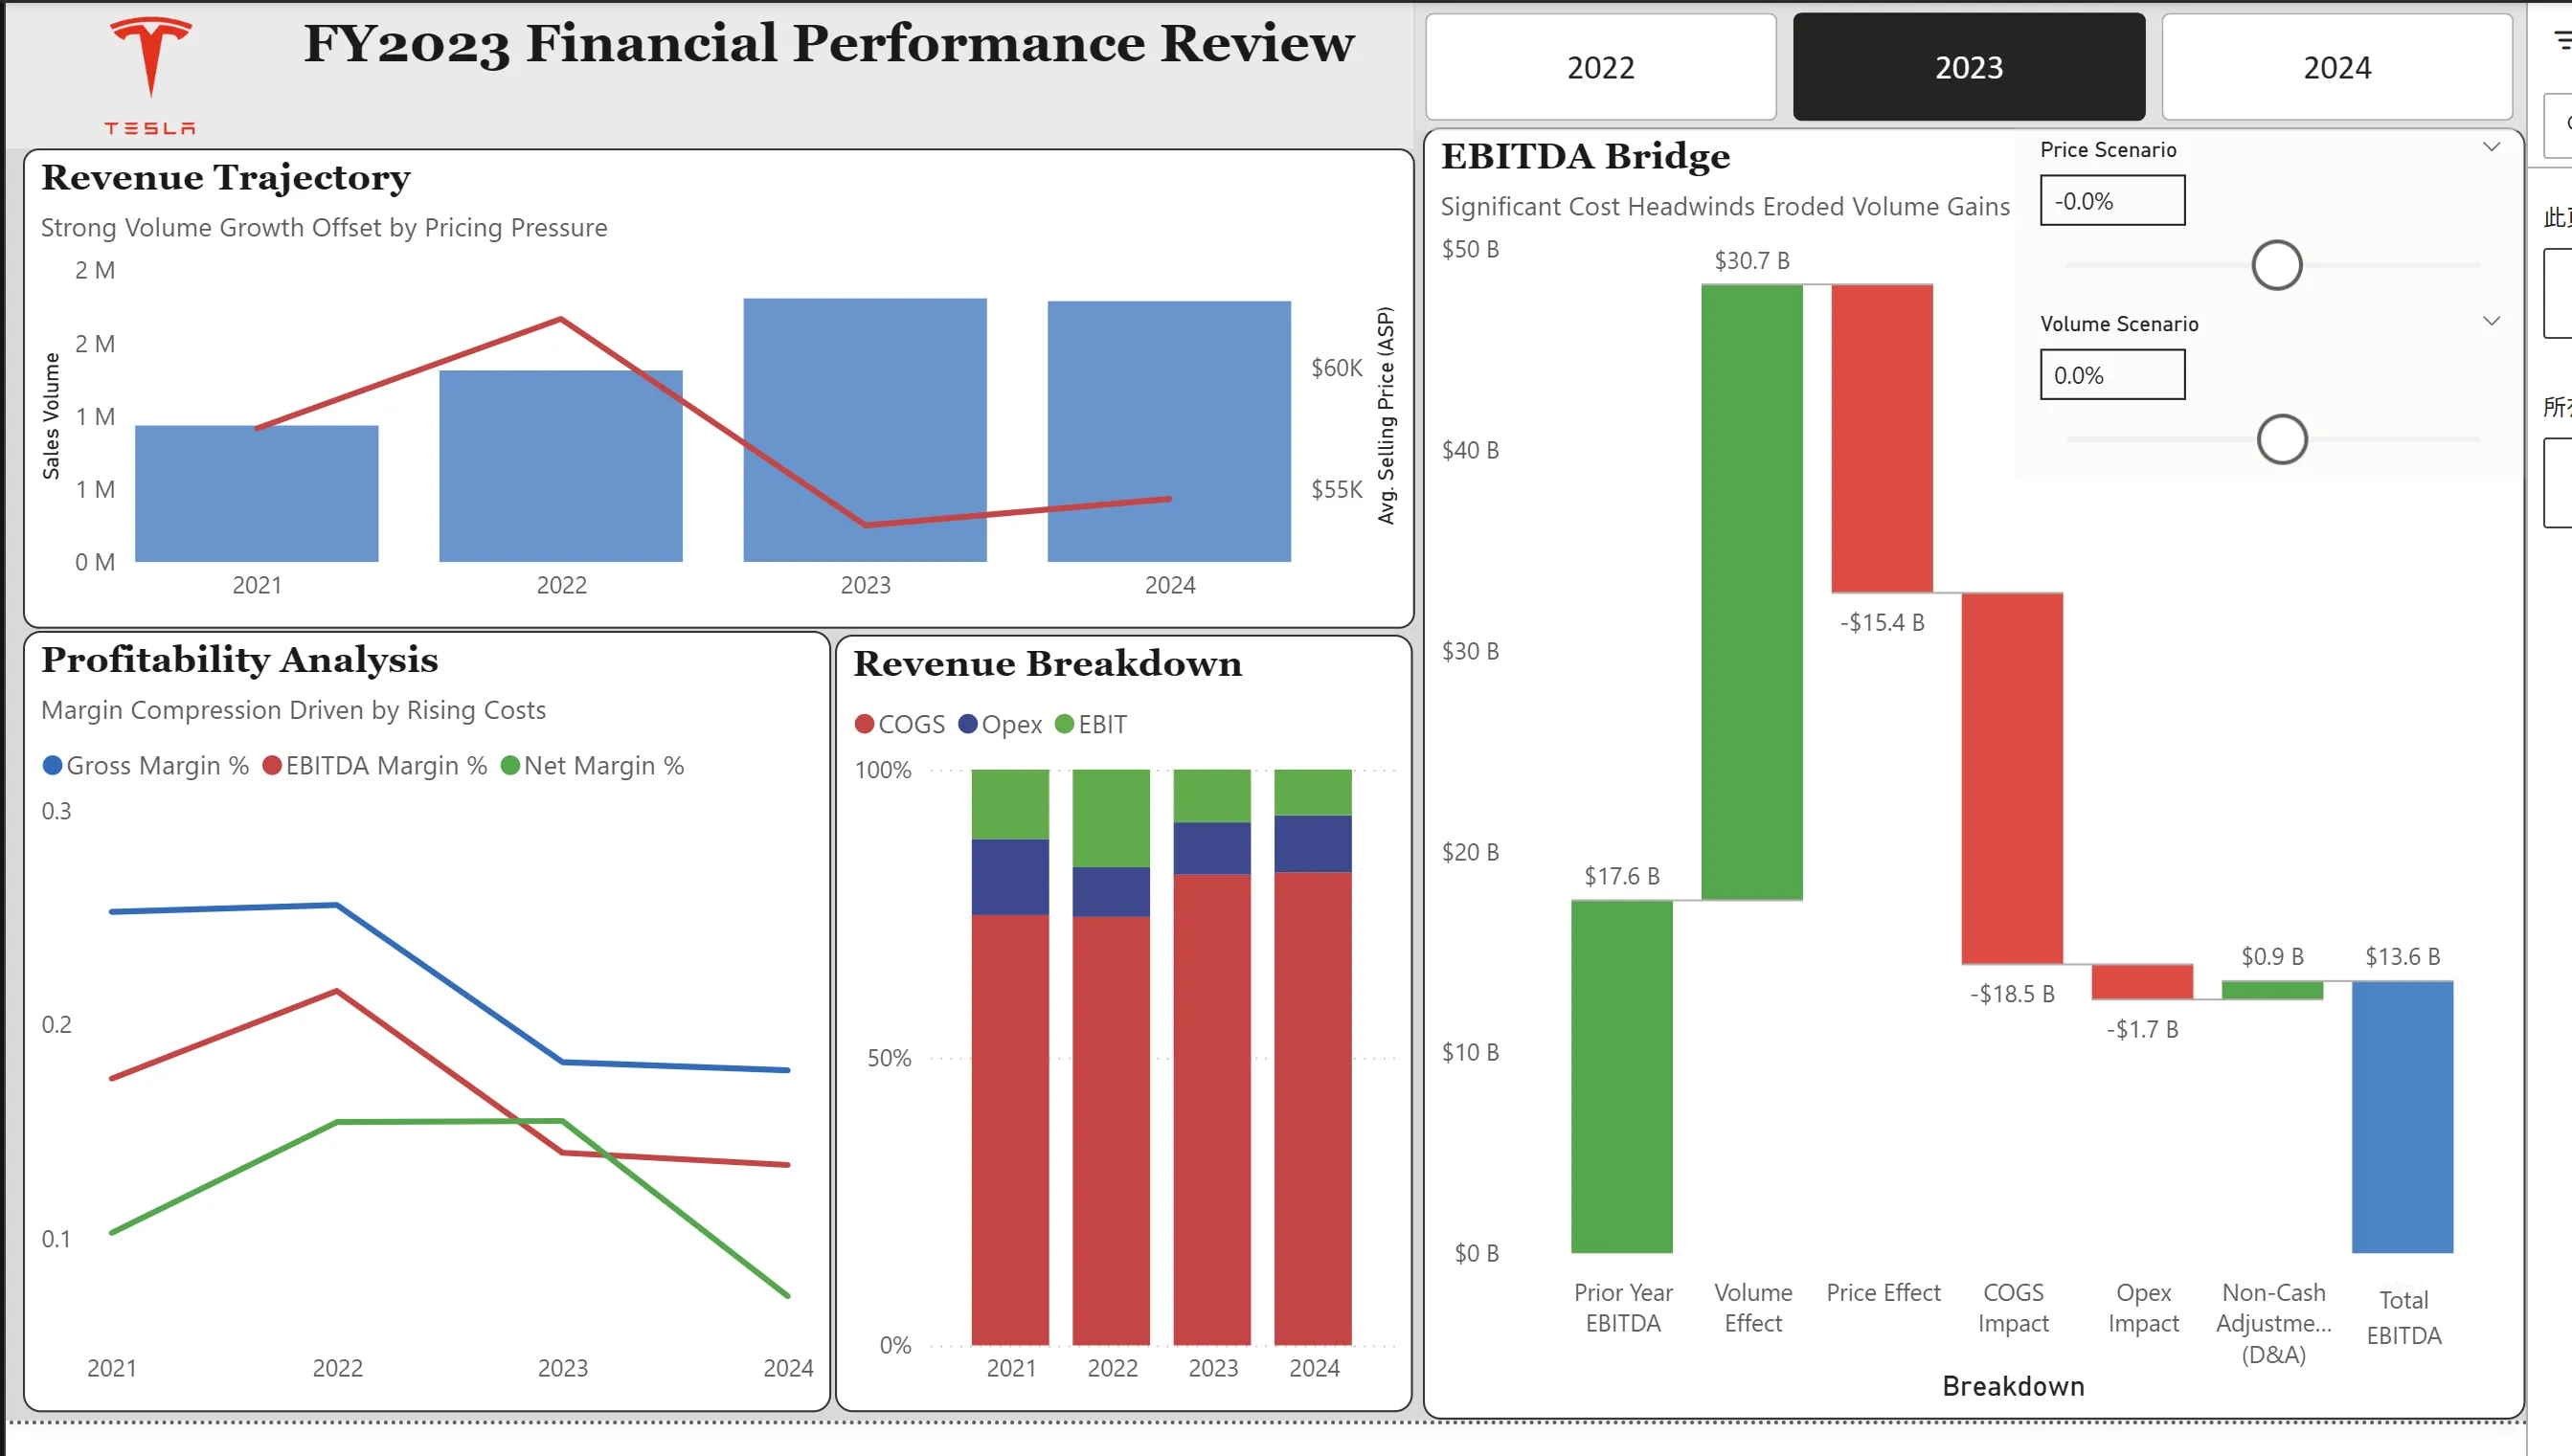
A case study analyzing Tesla's aggressive 2023 pricing strategy using EBITDA Bridge decomposition and scenario analysis to quantify the trade-off between volume gains and margin compression.
Fell in Love with Numbers
Exploring the intersection of code, statistics, and aesthetics.
Generative art and visualizations created with p5.js, R, and Python.
Collatz Network
Network visualization of Collatz conjecture sequences.

Harmonograph
Simulated pendulum harmonograph patterns.

Bauhaus Generator
Click to regenerate! Mondrian-inspired generative art.
Joy Division Plot
Unknown pleasures style ridgeline visualization.
Rose Curves
Mathematical rose curve artwork.

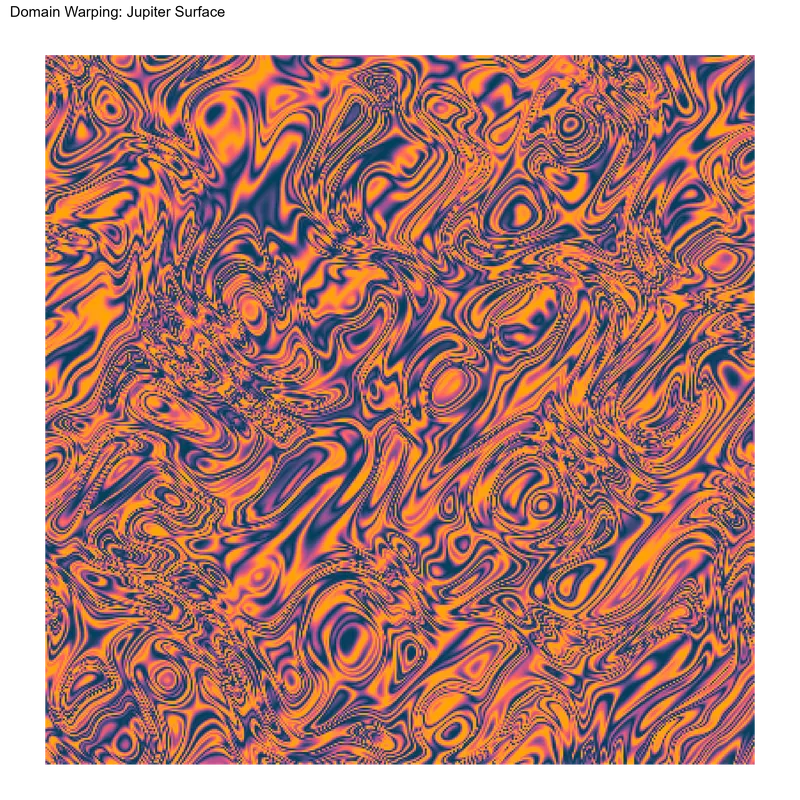
Flow Field
Particles dancing through Perlin noise currents.

Voronoi Cells
Voronoi tessellation pattern generation.
Cyber City
Generative cyberpunk cityscape.
Elegant Silk
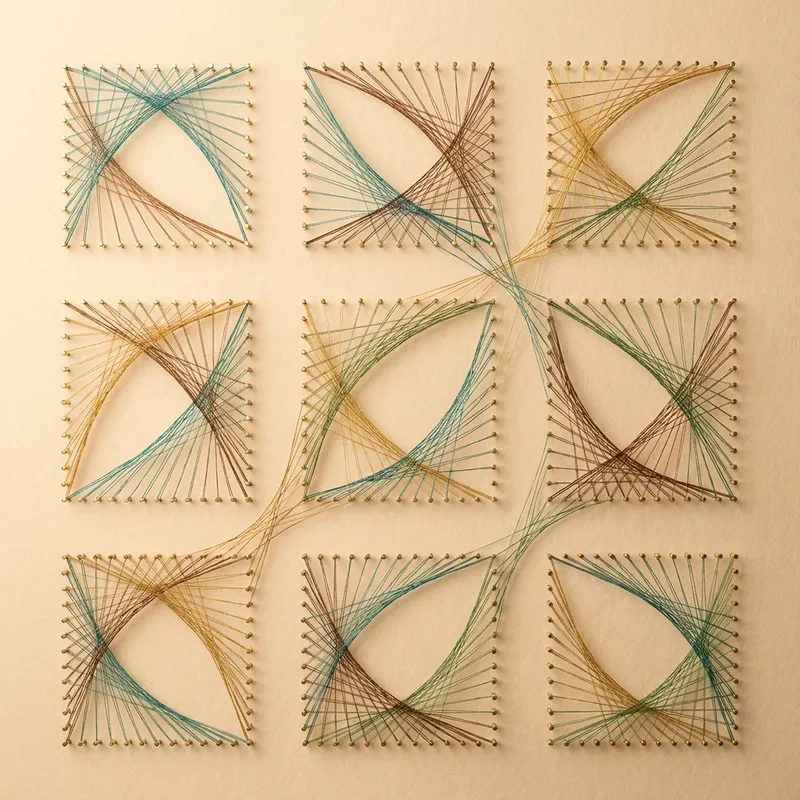
Click to regenerate! Bezier curve string art.
KNN Lissajous
K-nearest neighbor Lissajous curve visualization.
Liquid Marble
Fluid simulation marble texture.

Recursive Tree
Fractal tree with Perlin noise wind animation.
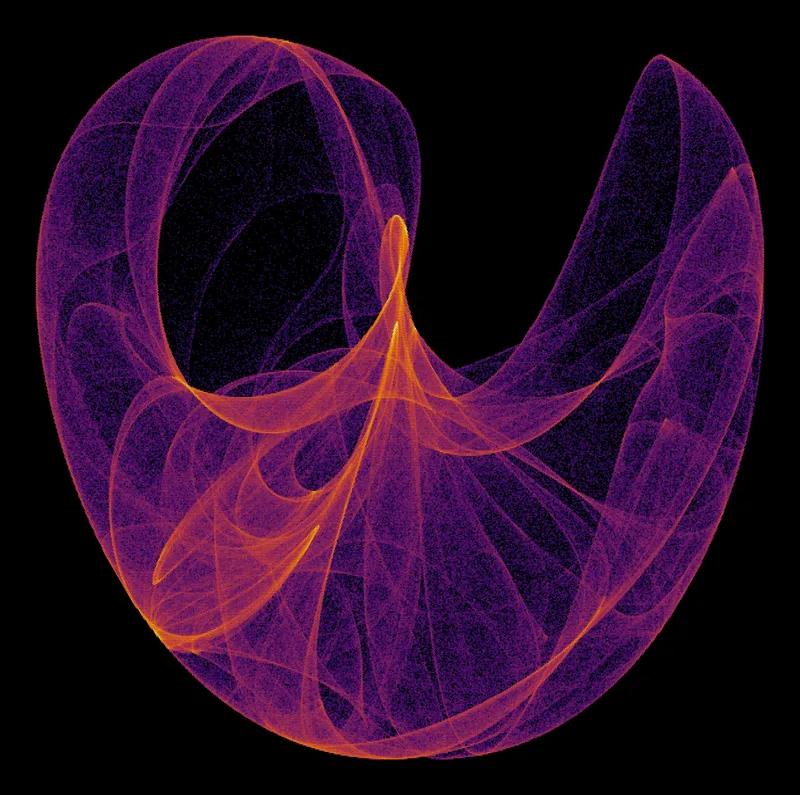
Peter de Jong Attractor
Strange attractor with parameters a=1.4, b=-2.3.

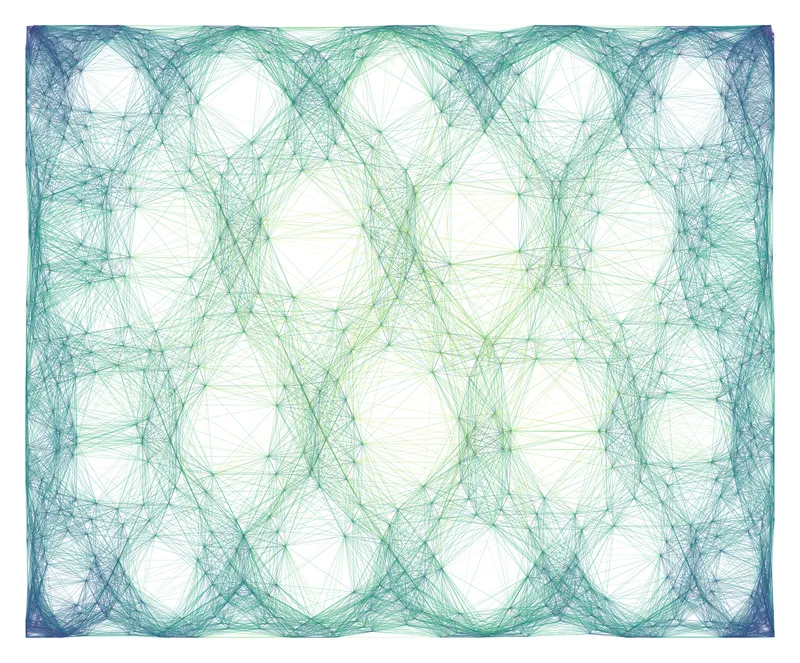
KNN Network
K-nearest neighbor network graph visualization.
Quantum Gyroscope
3D WebGL orbital rings. Drag to rotate.

Letter R
Interactive geometric typography with 3D cubes.