The Investment Clock: Using Python to Track the Business Cycle
The Investment Clock: A Data-Driven Approach to Business Cycle Investing
What is the Investment Clock?
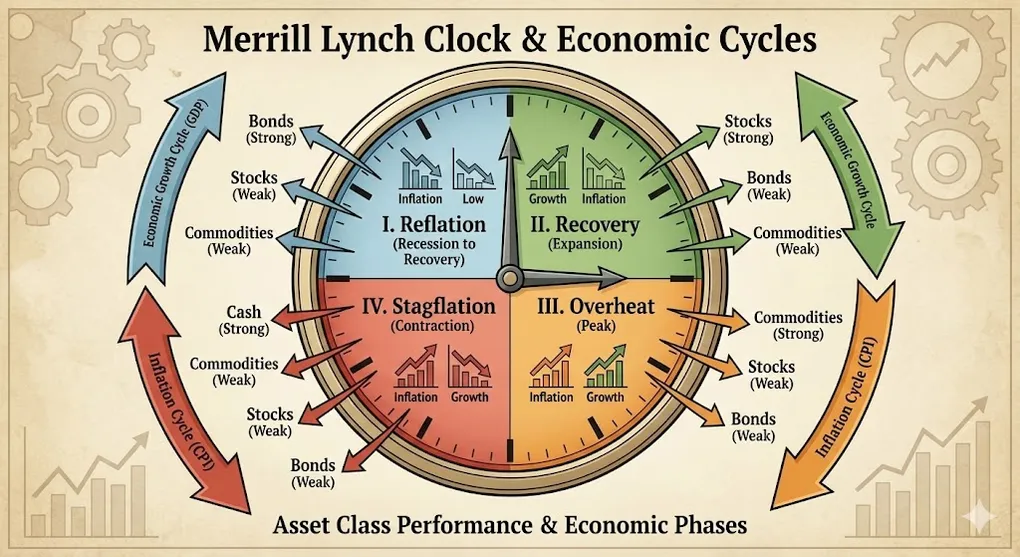
The Investment Clock (originally developed by Merrill Lynch, now Bank of America) is a framework that maps asset class performance to different phases of the economic cycle.
The core insight: Different assets outperform at different stages of the business cycle.
                      ↗ Inflation Rising
                            │
       ┌────────────────────┼────────────────────┐
       │                    │                    │
       │     OVERHEAT       │    STAGFLATION     │
       │                    │                    │
       │                    │                    │
       │   🏭 Commodities   │     💵 Cash        │
       │   Best: Energy,    │   Best: T-Bills,   │
       │   Materials        │   Money Market     │
       │                    │                    │
  ←────┼────────────────────┼────────────────────┼────→
 Growth                     │                         Growth
 Slowing                    │                         Rising
       │                    │                    │
       │    REFLATION       │     RECOVERY       │
       │                    │                    │
       │                    │                    │
       │   📈 Bonds         │    📊 Stocks       │
       │   Best: Treasuries,│   Best: Cyclicals, │
       │   Investment Grade │   Small Caps       │
       │                    │                    │
       └────────────────────┼────────────────────┘
                            │
                      ↘ Inflation Falling
The Four Phases Explained
1. 🚀 Recovery (Bottom-Left → Growth Rising, Inflation Falling)
| Characteristic | Description |
|---|---|
| Economy | GDP accelerating, output gap closing |
| Inflation | Still low or falling (slack in economy) |
| Fed Policy | Rates low, accommodative |
| Best Assets | Stocks (especially cyclicals, small caps) |
| Worst Assets | Cash, Commodities |
Why Stocks Win: Earnings growth accelerates while rates stay low. P/E expansion.
2. 🔥 Overheat (Top-Left → Growth Rising, Inflation Rising)
| Characteristic | Description |
|---|---|
| Economy | GDP strong, capacity constraints |
| Inflation | Rising (demand > supply) |
| Fed Policy | Starting to tighten |
| Best Assets | Commodities (Energy, Metals) |
| Worst Assets | Bonds (rising rates) |
Why Commodities Win: Real asset demand peaks, inflation hedge.
3. 📉 Stagflation (Top-Right → Growth Slowing, Inflation Rising)
| Characteristic | Description |
|---|---|
| Economy | GDP slowing, margins compressing |
| Inflation | Still elevated (supply shocks) |
| Fed Policy | Restrictive, fighting inflation |
| Best Assets | Cash / Short-term Bonds |
| Worst Assets | Stocks (earnings decline + rate pressure) |
Why Cash Wins: Nowhere to hide. Preserve capital.
4. 💤 Reflation (Bottom-Right → Growth Slowing, Inflation Falling)
| Characteristic | Description |
|---|---|
| Economy | Recession or soft landing |
| Inflation | Falling rapidly |
| Fed Policy | Cutting rates |
| Best Assets | Bonds (Treasuries) |
| Worst Assets | Commodities |
Why Bonds Win: Duration rally as rates fall. Flight to quality.
Implementing the Investment Clock with Python
Step 1: Define the Indicators
We need two axes:
- X-Axis (Growth): Is the economy accelerating or decelerating?
- Y-Axis (Inflation): Is inflation rising or falling?
from fredapi import Fred
import pandas as pd
import numpy as np

# Initialize FRED API
fred = Fred(api_key='YOUR_API_KEY')

# === GROWTH INDICATORS ===
# Real GDP YoY Change
gdp = fred.get_series('A191RL1Q225SBEA')  # Real GDP % Change

# Industrial Production YoY
ip = fred.get_series('INDPRO')
ip_yoy = ip.pct_change(12) * 100  # Year-over-Year

# Unemployment Rate (inverted - lower = better growth)
unemp = fred.get_series('UNRATE')

# === INFLATION INDICATORS ===
# Core PCE (Fed's preferred measure)
pce = fred.get_series('PCEPILFE')
pce_yoy = pce.pct_change(12) * 100

# CPI YoY
cpi = fred.get_series('CPIAUCSL')
cpi_yoy = cpi.pct_change(12) * 100
Step 2: Calculate Momentum (Rising vs Falling)
The Investment Clock cares about direction, not level:
def calculate_momentum(series, window=6):
    """
    Calculate if a series is rising or falling
    Returns: +1 (rising), -1 (falling), 0 (flat)
    """
    # 6-month moving average vs 12-month moving average
    ma_short = series.rolling(window=3).mean()
    ma_long = series.rolling(window=12).mean()

    momentum = np.where(ma_short > ma_long, 1, -1)
    return pd.Series(momentum, index=series.index)

# Growth Momentum: Positive = Accelerating
growth_momentum = calculate_momentum(ip_yoy)

# Inflation Momentum: Positive = Rising
inflation_momentum = calculate_momentum(pce_yoy)
Step 3: Map to Clock Quadrants
def get_clock_phase(growth, inflation):
    """
    Map growth and inflation momentum to Investment Clock phase

    Parameters:
        growth: +1 (accelerating) or -1 (decelerating)
        inflation: +1 (rising) or -1 (falling)

    Returns:
        Phase name and recommended assets
    """
    phases = {
        (1, -1): {
            'phase': 'RECOVERY',
            'emoji': '🚀',
            'best_assets': ['Stocks', 'Cyclicals', 'Small Caps'],
            'worst_assets': ['Cash', 'Commodities'],
            'color': '#22c55e'  # Green
        },
        (1, 1): {
            'phase': 'OVERHEAT',
            'emoji': '🔥',
            'best_assets': ['Commodities', 'Energy', 'Materials'],
            'worst_assets': ['Bonds', 'Duration'],
            'color': '#f97316'  # Orange
        },
        (-1, 1): {
            'phase': 'STAGFLATION',
            'emoji': '📉',
            'best_assets': ['Cash', 'T-Bills', 'Money Market'],
            'worst_assets': ['Stocks', 'Bonds'],
            'color': '#ef4444'  # Red
        },
        (-1, -1): {
            'phase': 'REFLATION',
            'emoji': '💤',
            'best_assets': ['Bonds', 'Treasuries', 'Gold'],
            'worst_assets': ['Commodities', 'Cyclicals'],
            'color': '#3b82f6'  # Blue
        }
    }

    return phases.get((growth, inflation), {'phase': 'UNKNOWN'})

# Apply to latest data
latest_growth = growth_momentum.iloc[-1]
latest_inflation = inflation_momentum.iloc[-1]
current_phase = get_clock_phase(latest_growth, latest_inflation)

print(f"Current Phase: {current_phase['emoji']} {current_phase['phase']}")
print(f"Best Assets: {', '.join(current_phase['best_assets'])}")
Step 4: Time-Series of Clock Phases
# Create historical phase mapping
clock_history = pd.DataFrame({
    'date': ip_yoy.index,
    'growth_momentum': growth_momentum,
    'inflation_momentum': inflation_momentum
})

clock_history['phase'] = clock_history.apply(
    lambda row: get_clock_phase(
        row['growth_momentum'],
        row['inflation_momentum']
    )['phase'],
    axis=1
)

# Count days in each phase
phase_distribution = clock_history['phase'].value_counts(normalize=True)
print(phase_distribution)
Connecting to Real Dashboard Metrics
If you have a macro dashboard (like my Global Macro Dashboard), you can enhance the Investment Clock with additional confirmation signals:
| Clock Phase | Confirmation Signals |
|---|---|
| Recovery | Sahm Rule < 0.3, Yield Curve Steepening, VIX Falling |
| Overheat | Taylor Rule Gap (Fed behind), Copper/Gold Rising |
| Stagflation | Taylor Rule Gap (Fed tight), Gold/Oil Rising |
| Reflation | Yield Curve Inverted, Real Rates Turning Negative |
# Enhanced Phase Detection with Multiple Signals
def enhanced_clock_signal(row):
    base_phase = get_clock_phase(row['growth'], row['inflation'])

    # Add confidence score based on confirming indicators
    confidence = 0

    if base_phase['phase'] == 'RECOVERY':
        if row['yield_curve_slope'] > 0:  # Steepening
            confidence += 1
        if row['vix'] < 20:
            confidence += 1

    elif base_phase['phase'] == 'OVERHEAT':
        if row['copper_gold_ratio_momentum'] > 0:
            confidence += 1
        if row['taylor_gap'] < 0:  # Fed behind curve
            confidence += 1

    # ... add more rules

    return {**base_phase, 'confidence': confidence}
Visualization: The Clock Dashboard
import plotly.graph_objects as go
import plotly.express as px

def plot_investment_clock(growth, inflation, phase_info):
    """Create a visual Investment Clock"""

    fig = go.Figure()

    # Draw quadrant backgrounds
    quadrants = [
        {'x': [0, 1, 1, 0], 'y': [0, 0, 1, 1], 'color': '#22c55e20', 'name': 'Recovery'},
        {'x': [-1, 0, 0, -1], 'y': [0, 0, 1, 1], 'color': '#f9731620', 'name': 'Overheat'},
        {'x': [-1, 0, 0, -1], 'y': [-1, -1, 0, 0], 'color': '#ef444420', 'name': 'Stagflation'},
        {'x': [0, 1, 1, 0], 'y': [-1, -1, 0, 0], 'color': '#3b82f620', 'name': 'Reflation'},
    ]

    for q in quadrants:
        fig.add_trace(go.Scatter(
            x=q['x'], y=q['y'],
            fill='toself',
            fillcolor=q['color'],
            line=dict(width=0),
            name=q['name'],
            showlegend=False
        ))

    # Plot current position
    fig.add_trace(go.Scatter(
        x=[growth],
        y=[inflation],
        mode='markers+text',
        marker=dict(size=20, color=phase_info['color']),
        text=[f"{phase_info['emoji']} NOW"],
        textposition='top center',
        name='Current Position'
    ))

    # Labels
    fig.update_layout(
        title='📊 Investment Clock: Current Position',
        xaxis_title='← Growth Slowing | Growth Rising →',
        yaxis_title='← Inflation Falling | Inflation Rising →',
        xaxis=dict(range=[-1.2, 1.2], zeroline=True),
        yaxis=dict(range=[-1.2, 1.2], zeroline=True),
    )

    return fig
Limitations & Caveats
| Limitation | Explanation |
|---|---|
| Lagging Data | GDP is quarterly, released with delay. Use leading proxies. |
| Phase Transitions | Clock phases don’t switch cleanly. Expect noise. |
| Secular Trends | Doesn’t account for structural shifts (AI revolution, demographics). |
| Global Factors | US-centric. May not apply to EM or export economies. |
Pro Tip: Use the Investment Clock as a framework, not a trading system. Combine with fundamental analysis and risk management.
Key Takeaways
- The Investment Clock maps asset performance to economic cycles
- Two axes matter: Growth momentum and Inflation momentum
- Use FRED data (IP, PCE, GDP) to calculate current phase
- Confirm with signals: Yield curve, VIX, Copper/Gold ratio
- Automate with Python: Build a dashboard that updates daily