Automated Global Macroeconomic Dashboard
An end-to-end data pipeline and interactive dashboard designed to monitor economic health, Fed policy gaps, and market risks using Python and Power BI.
Executive Summary
An end-to-end data pipeline and interactive dashboard designed to monitor economic health, Fed policy gaps, and market risks using Python and Power BI.
Executive Summary
In the high-stakes world of investment analysis, speed and accuracy are paramount. Analysts often waste hours on manual data gathering, leaving little time for insight.
This project engineered an end-to-end automated data pipeline that eliminates manual toil. By integrating Python ETL with GitHub Actions for CI/CD automation, I created a “zero-touch” system. The resulting Power BI dashboard applies complex financial logic—such as the Taylor Rule and Sahm Rule—to assess recession risks and Federal Reserve policy errors in real-time.
The Challenge
Investment analysts often spend 80% of their time on low-value tasks: manually downloading CSVs from the Federal Reserve (FRED), cleaning messy data in Excel, and updating static charts.
This latency creates a “knowledge gap” where critical market inflection points—like a yield curve inversion or a shift in liquidity—are identified too late. My goal was to reduce this data update time from hours to zero.
Methodology & Architecture
My approach bridged the gap between Software Engineering and Financial Analysis, utilizing a serverless architecture to minimize costs while maximizing reliability.
1. Automated ETL Pipeline (Python)
I developed a robust Python script to handle the data lifecycle:
- Extraction: Automated API calls to FRED (Macro data) and Yahoo Finance (Market data).
- Transformation: Implemented
pandasfor time-series alignment (resampling daily/monthly data) and data imputation. - Financial Logic Injection: Instead of calculating metrics in Power BI, I pre-calculated complex models in Python:
- Taylor Rule: To measure if the Fed is “behind the curve.”
- Liquidity Metrics: M2 Money Supply and Real Rates.
- Recession Signals: The Sahm Rule and Yield Curve Inversion (10Y-2Y).
2. CI/CD Automation (GitHub Actions)
To ensure the data is always fresh, I deployed a GitHub Actions workflow that triggers a cron job every day at 00:00 UTC. This “headless” process fetches new data, updates the dataset, and pushes it back to the repository, effectively using GitHub as a high-availability database.
3. Visualization Layer (Power BI)
The dashboard connects directly to the GitHub Raw Data stream. Stakeholders see the latest data instantly upon refreshing, without needing local file access.
Dashboard Gallery & Insights
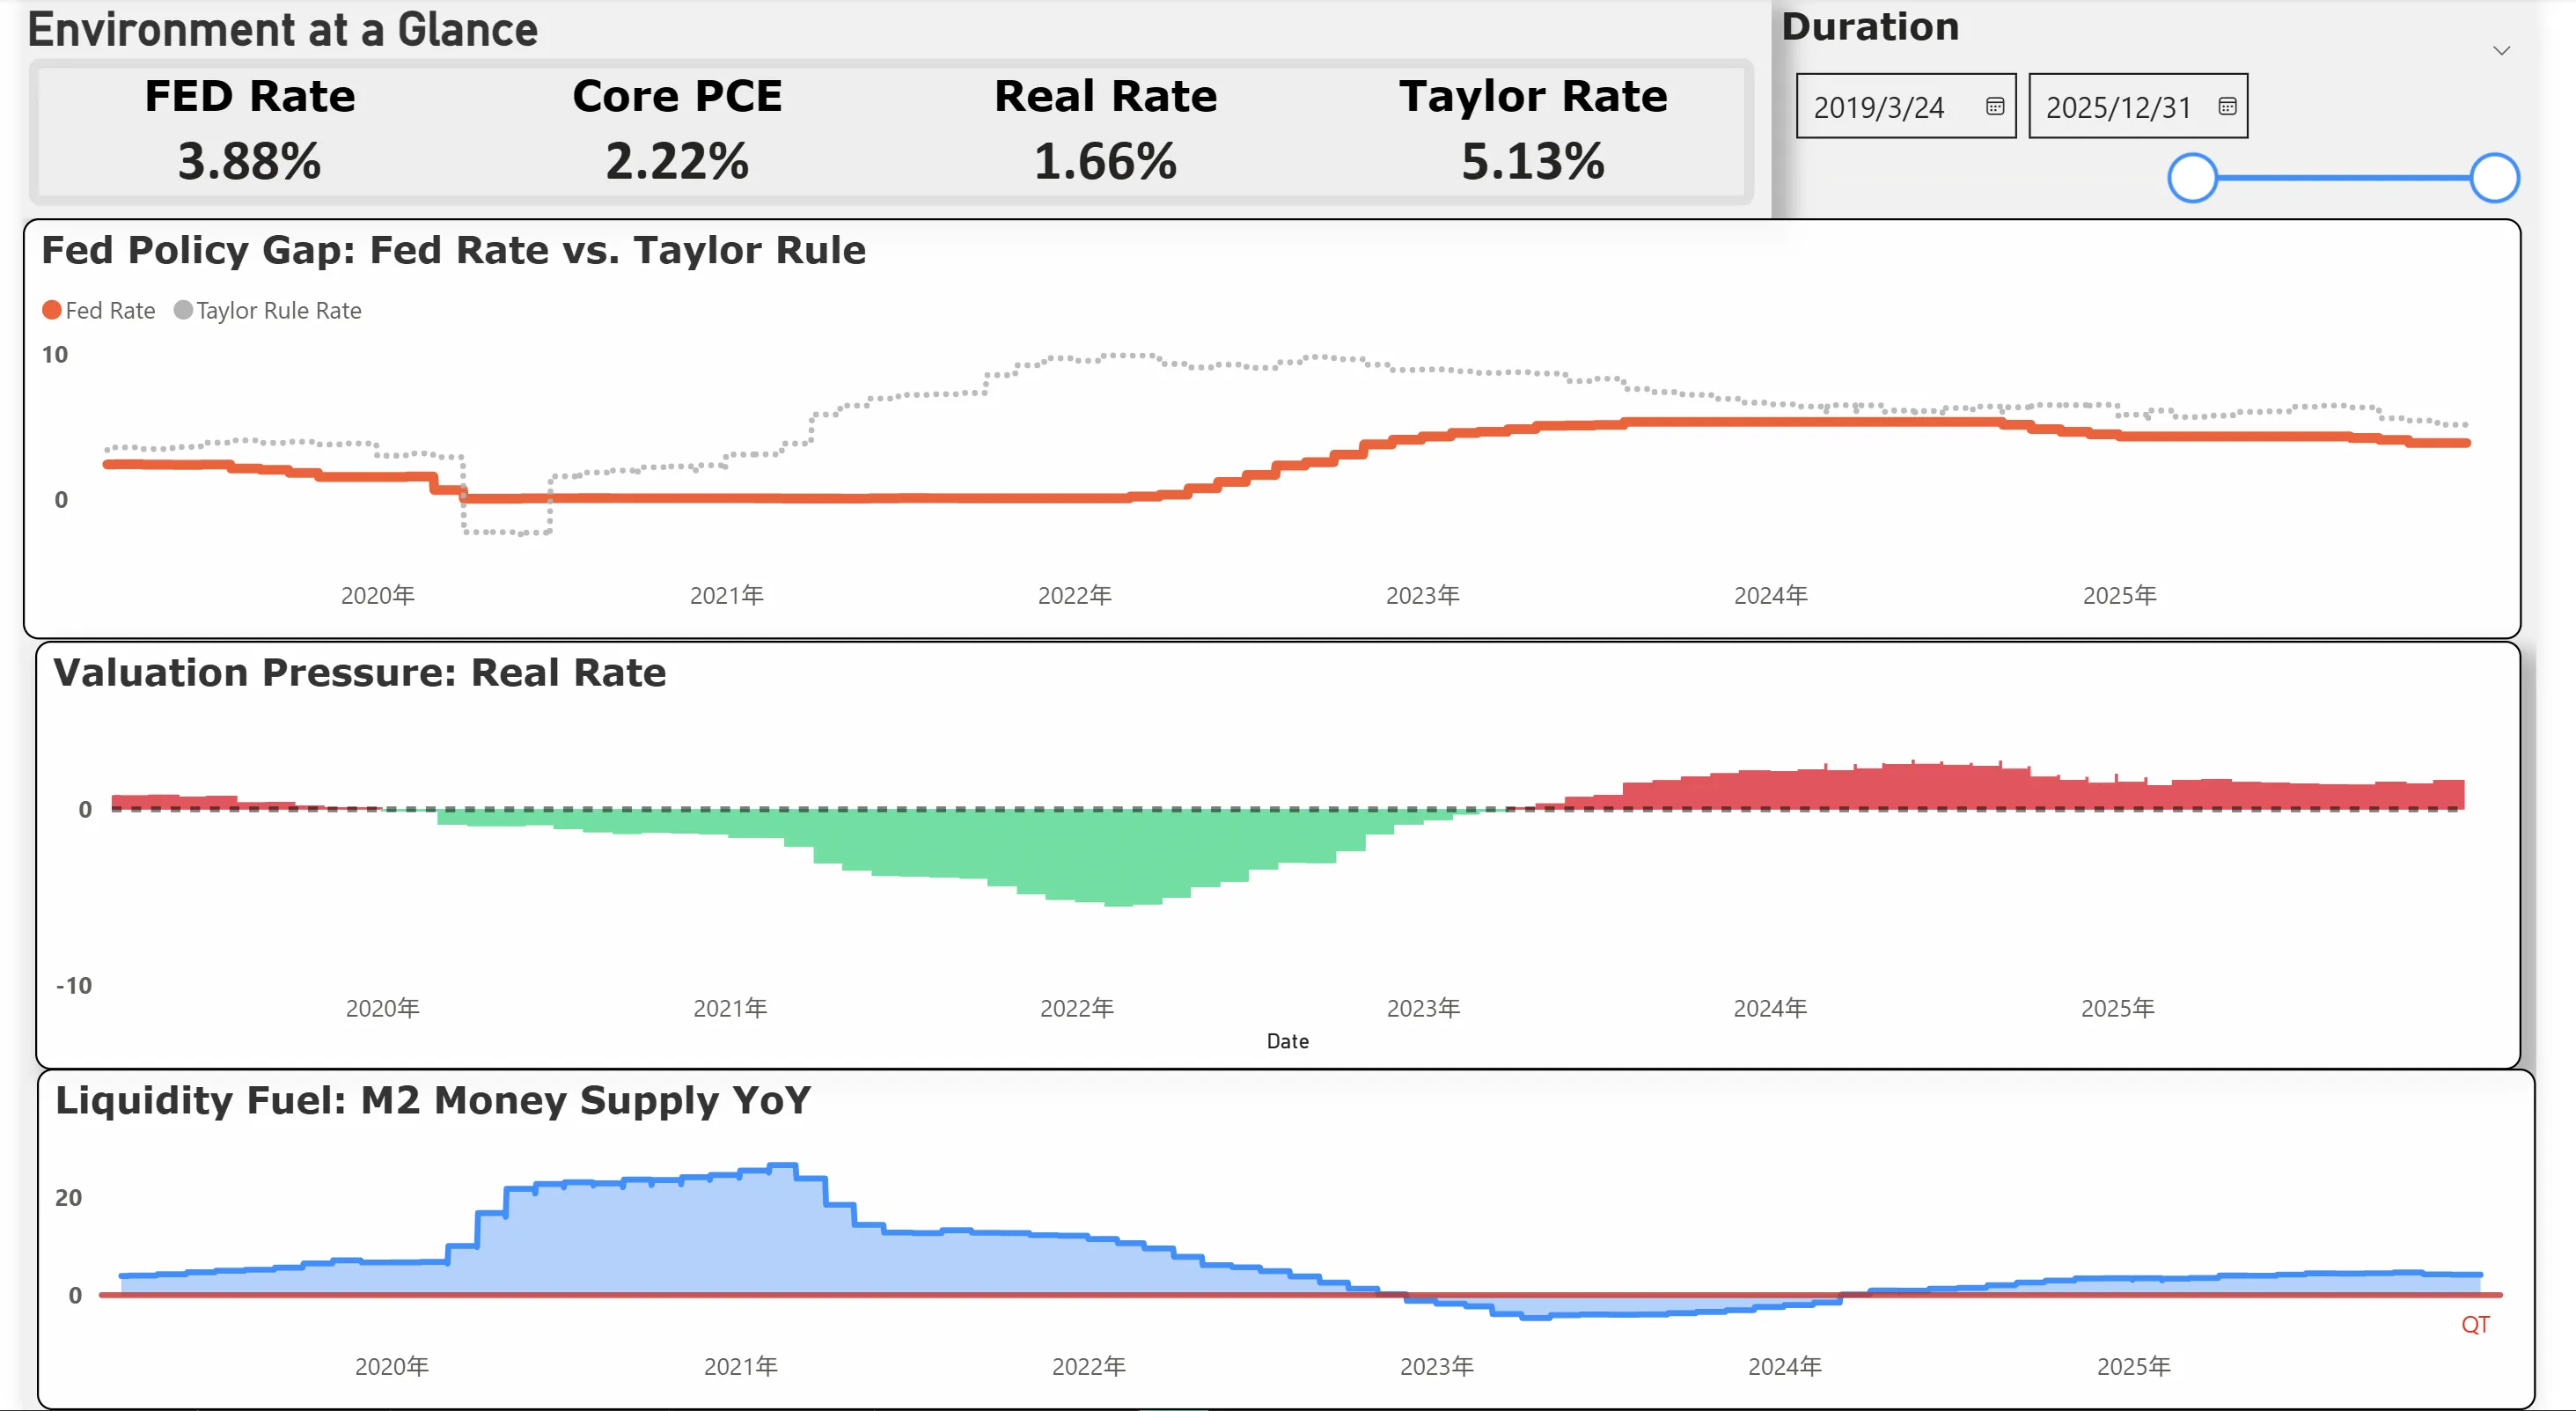
A. Fed Policy & Liquidity
The core of the analysis. Visualizing the Fed Policy Gap (Fed Rate vs. Taylor Rule) to determine if monetary policy is restrictive.
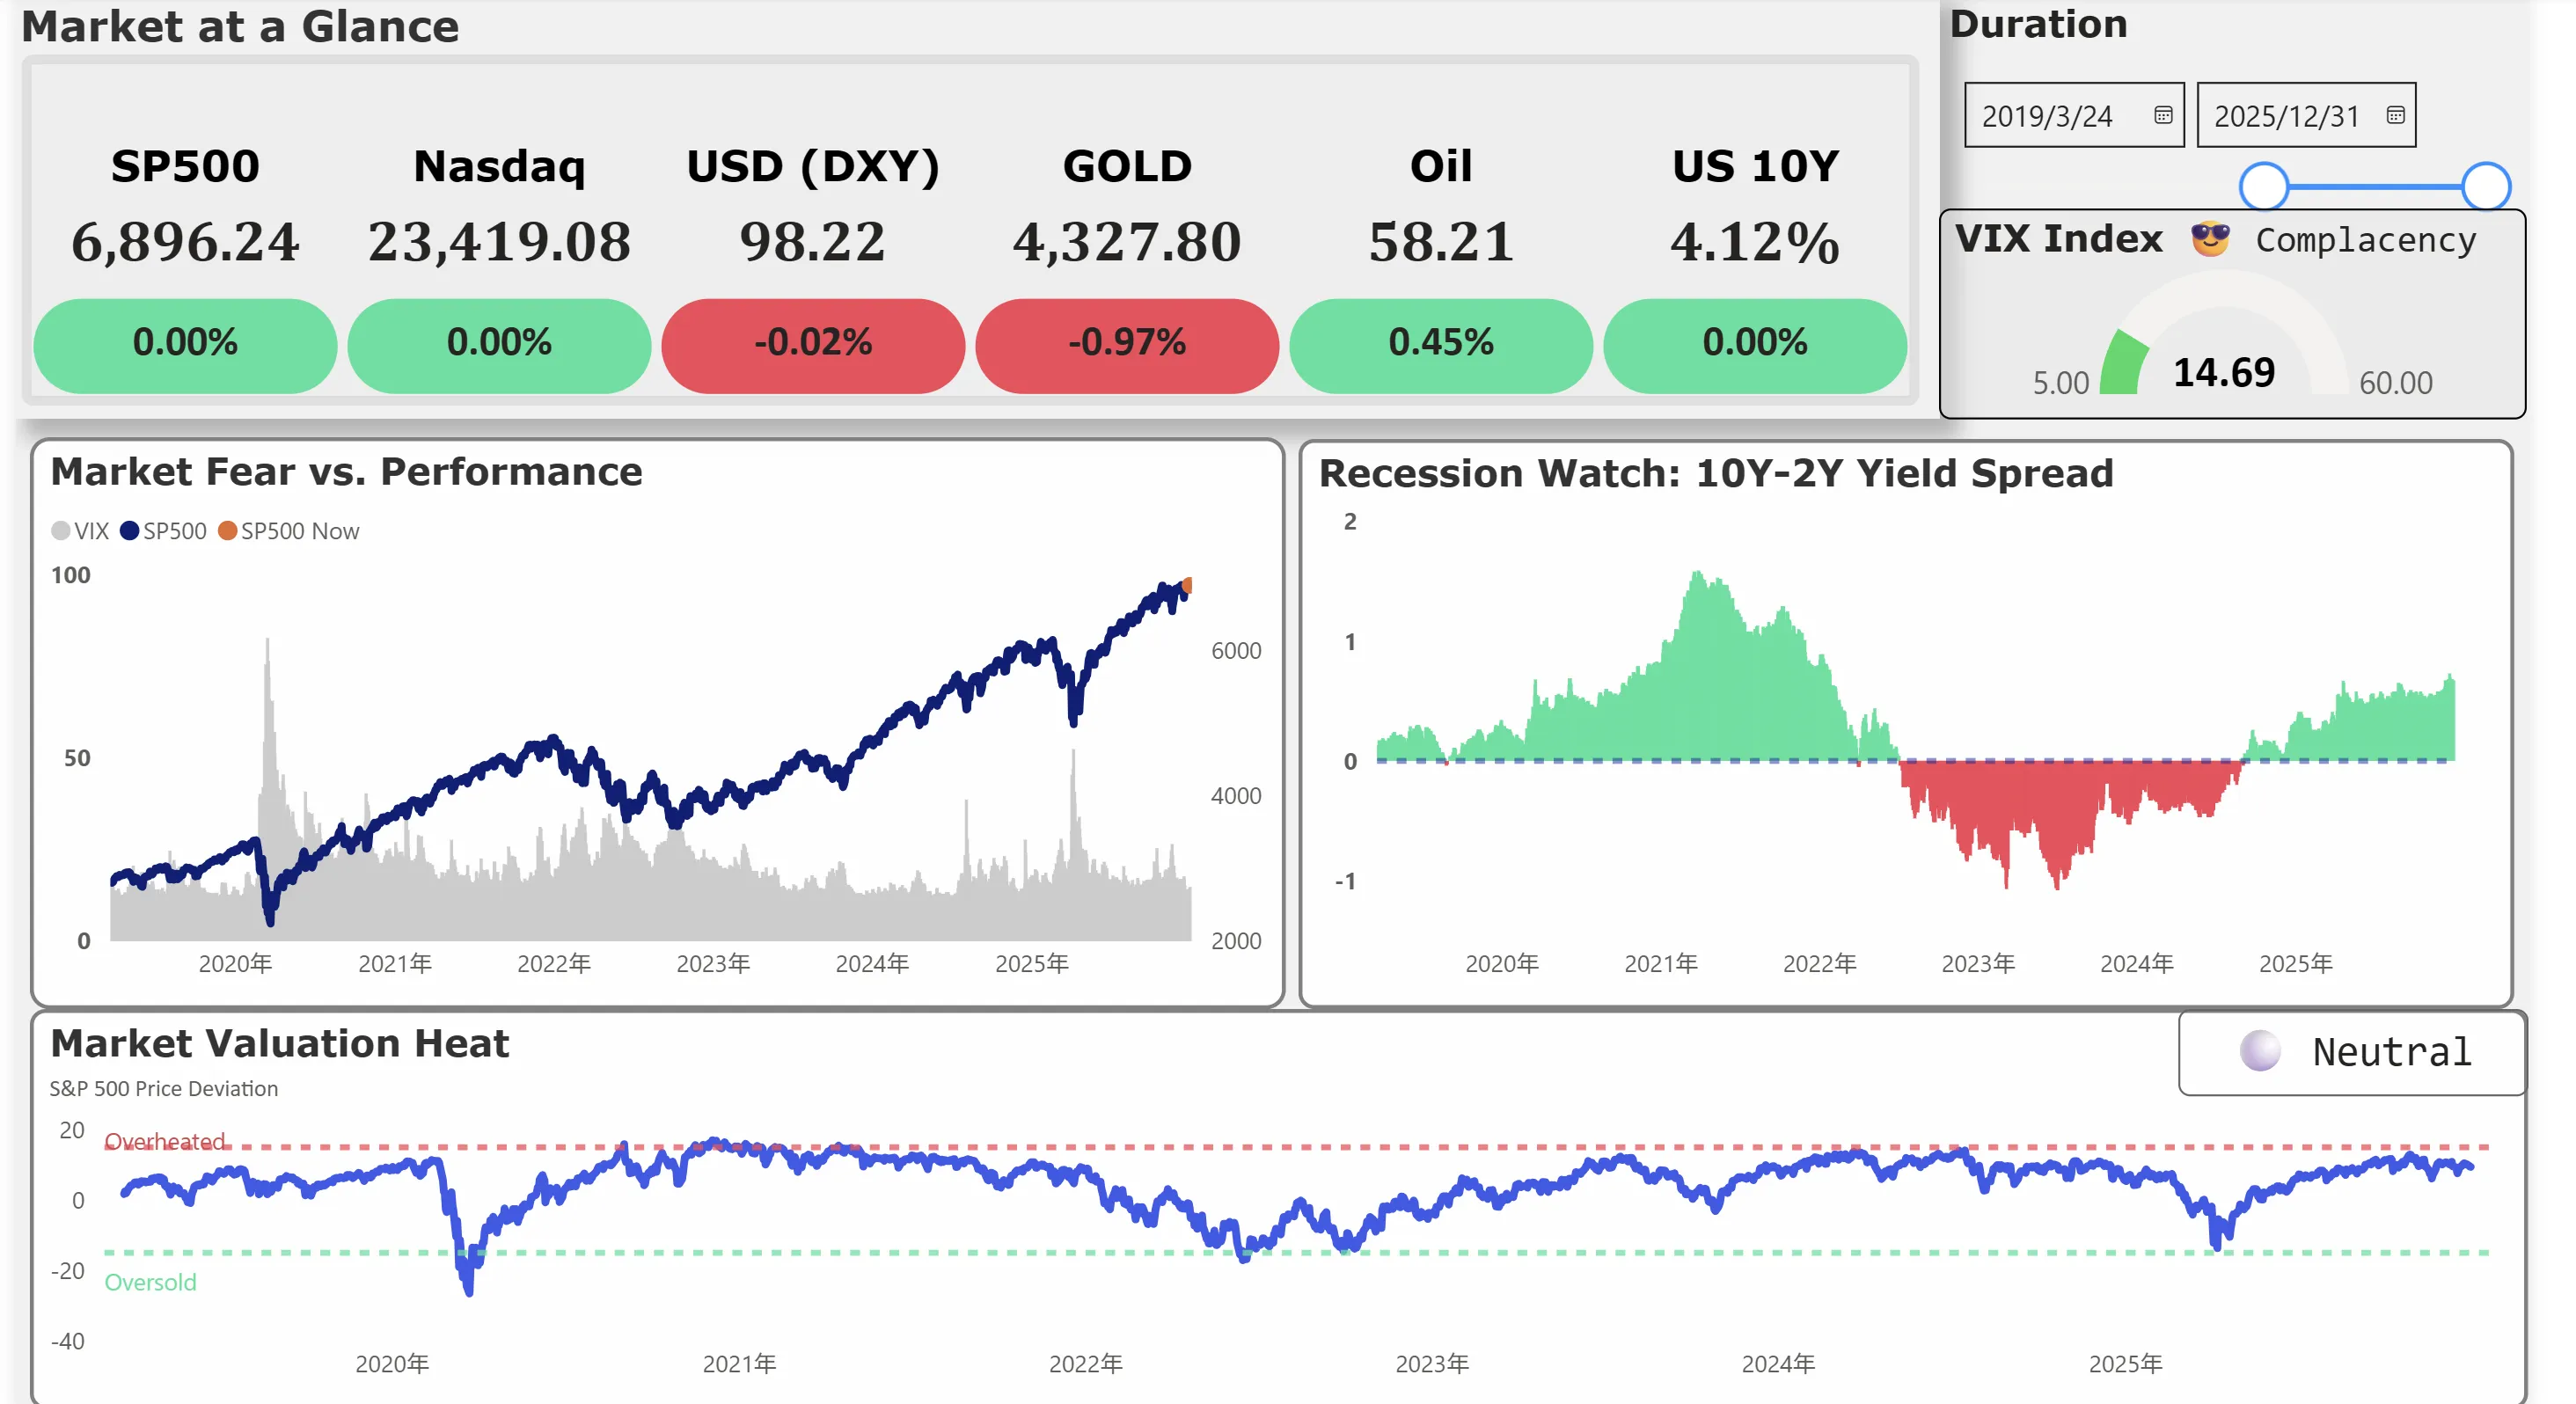
B. Market Valuation & Sentiment
A comprehensive view of major indices combined with a Fear Gauge (VIX) and a custom Valuation Heatmap.
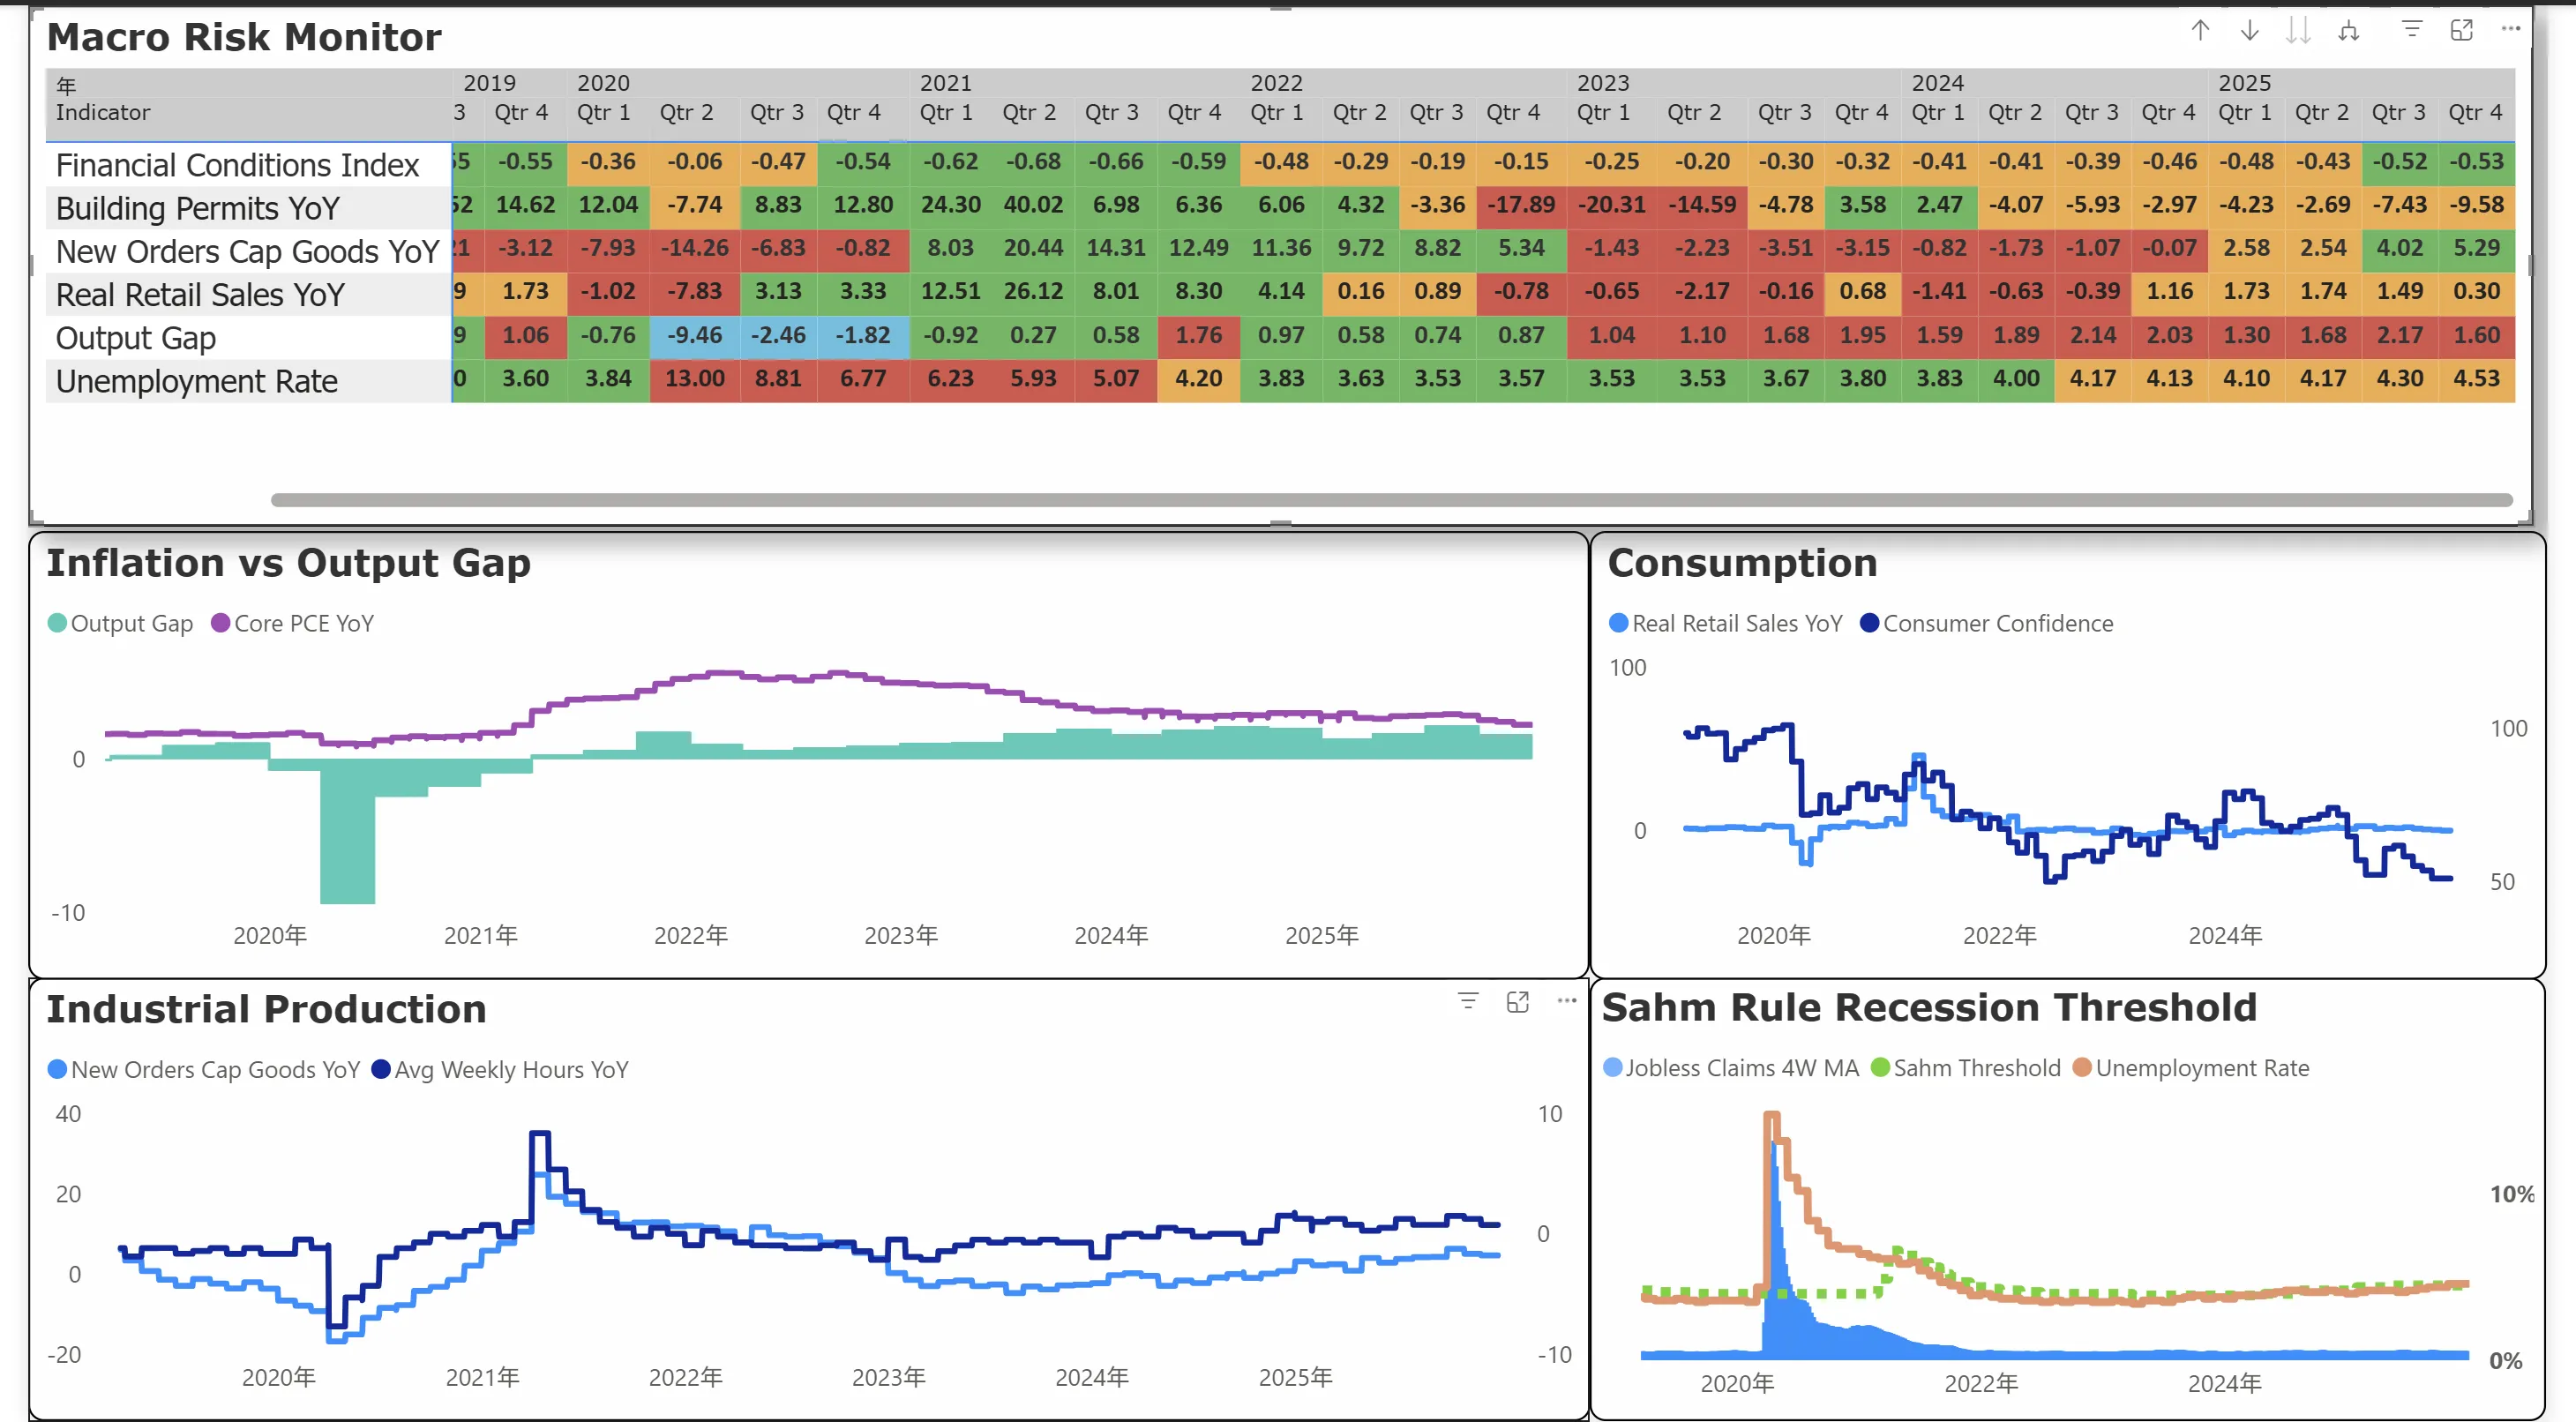
C. Macro Risk Monitor
A heatmap style monitor to track Leading Economic Indicators (LEI) for a quick “health check” on Housing, Manufacturing, and Consumption.
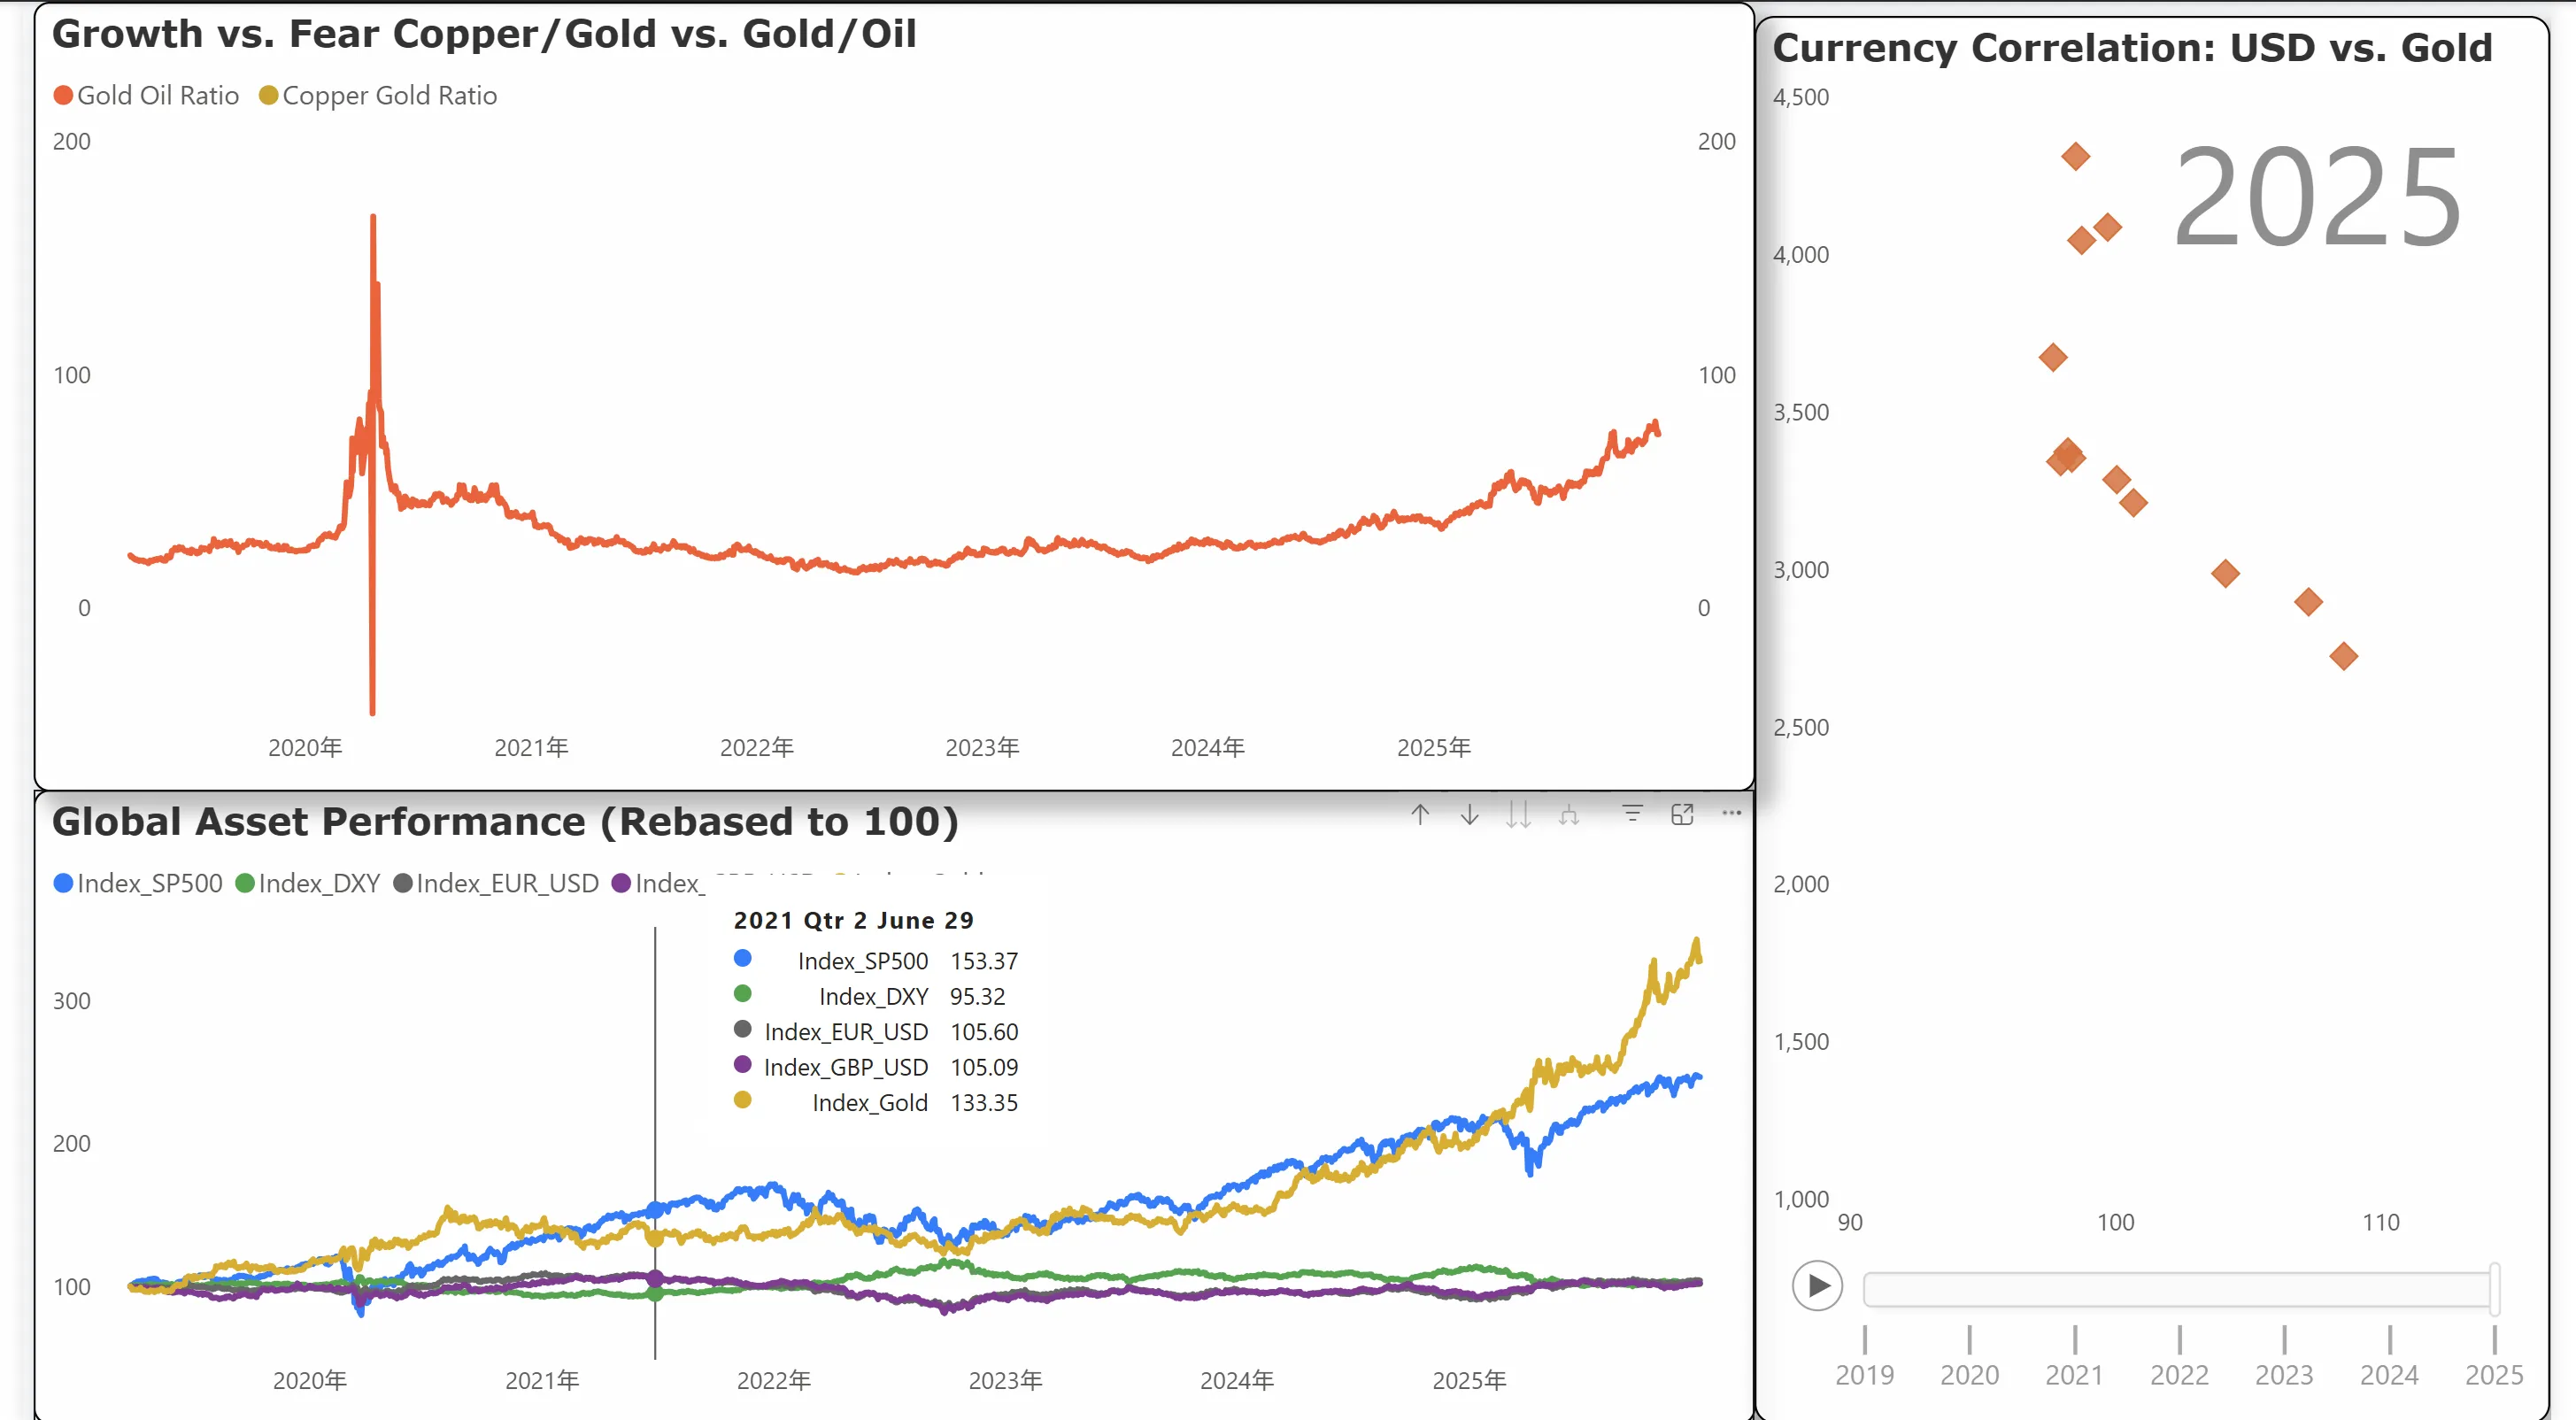
D. Inter-market Correlations
Analyzing the Copper/Gold Ratio to identify structural shifts in the global economy.
Impact & Results
Operational Efficiency
- 100% Automation: Reduced data collection time from 2 hours/week to 5 seconds.
- Reliability: Eliminated human error in formula calculations and data entry.
Analytical Insights
Based on the dashboard’s current signals:
- Restrictive Policy: The Fed Rate is currently tracking above the Taylor Rule estimate, suggesting monetary policy is actively slowing down economic growth.
- Recession Watch: The Sahm Rule indicator has shown elevated momentum in the unemployment rate, signaling caution for labor market stability.
Next Steps
- Predictive Analytics: Integrating Machine Learning models (e.g., Prophet) to forecast CPI and Unemployment trends 6 months out.
- Database Migration: Moving from CSV storage to Snowflake or BigQuery to handle larger datasets.
- Sentiment Analysis: Using NLP to scrape central bank meeting minutes and quantify “Hawkish” vs. “Dovish” sentiment.