Tesla Pricing Strategy Impact Analysis
A case study analyzing Tesla's aggressive 2023 pricing strategy using EBITDA Bridge decomposition and scenario analysis to quantify the trade-off between volume gains and margin compression.
Executive Summary
A case study analyzing Tesla's aggressive 2023 pricing strategy using EBITDA Bridge decomposition and scenario analysis to quantify the trade-off between volume gains and margin compression.
Executive Summary
In 2023, Tesla made headlines with aggressive price cuts across its vehicle lineup. While bulls argued this would drive volume growth, bears warned of margin destruction.
Tesla Stock Price with Key Events
Loading Tesla stock chart...
This project quantifies both sides of the argument.
Using an EBITDA Bridge (Waterfall Chart) and Scenario Analysis, I decompose Tesla’s financial performance into actionable components:
- Price Effect: How much did price cuts drag EBITDA?
- Volume Effect: How much did increased deliveries boost EBITDA?
- Cost Impact: Did economies of scale offset the pricing pressure?
EBITDA Bridge Chart
Loading chart...
Dashboard Demo: Scenario Analysis
📊 Chart Interpretation
What You’re Seeing:
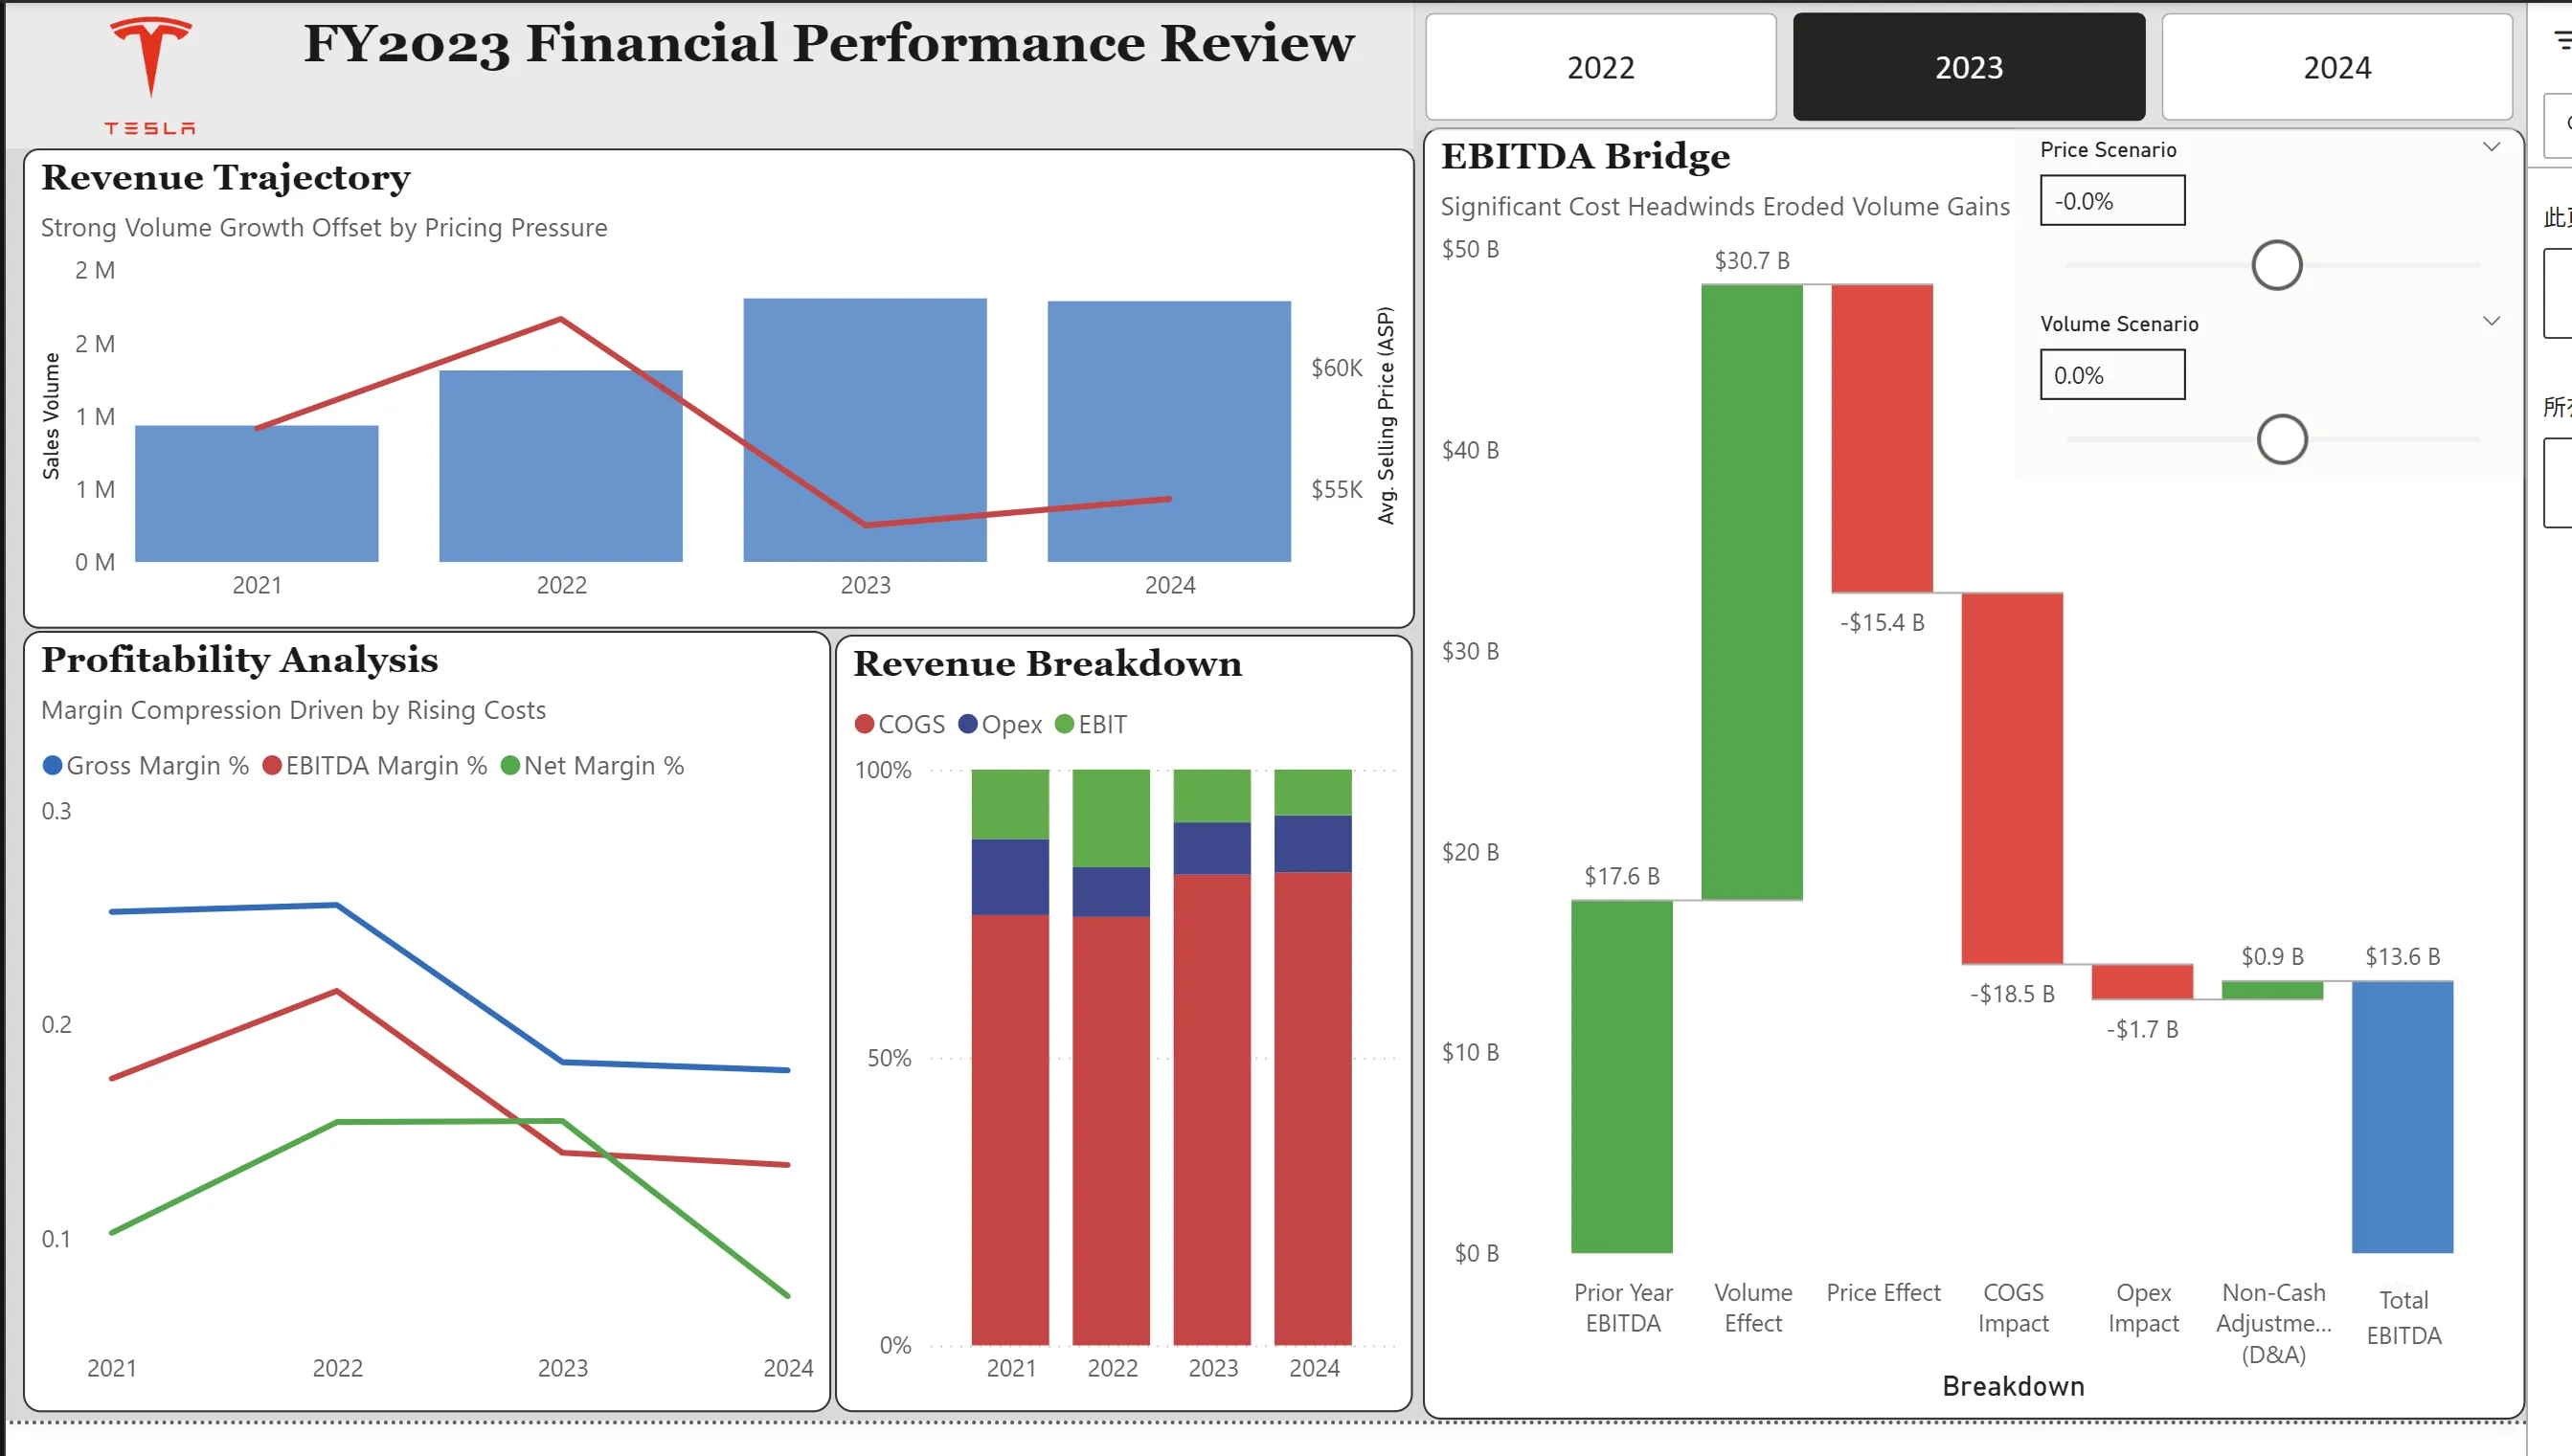
The dashboard above demonstrates real-time sensitivity analysis. As the Price Scenario slider moves, watch how the EBITDA Bridge waterfall chart responds—this is the core of our “What-If” framework.
Key Observations from the Visualization:
| Chart Element | What It Shows | Analyst Interpretation |
|---|---|---|
| Revenue Trajectory (Top-Left) | Volume (blue bars) vs ASP (red line) | Tesla successfully grew deliveries, but at the cost of falling ASP. The divergence between the two lines represents the margin compression thesis. |
| Profitability Analysis (Bottom-Left) | Gross/EBITDA/Net Margin trends | All three margin metrics peaked in 2022 and have trended downward—a clear signal that pricing power has eroded faster than cost efficiencies have materialized. |
| Revenue Breakdown (Center) | COGS/Opex/EBIT stacked view | COGS (red) is growing proportionally faster than EBIT (blue), indicating that the “manufacturing cost curve” narrative has not yet delivered. |
| EBITDA Bridge (Right) | Waterfall decomposition | The centerpiece. Volume Effect (+15.4B) and COGS Impact (-$18.5B). |
💡 Investment Implications
The Scenario Slider Reveals the Key Trade-Off:
- At +5% Price Increase: EBITDA rises to **10.5B)
- At Base Case (+1%): EBITDA at **15.4B)
- At -5% Price Cut: EBITDA drops to **20.2B)
The Bottom Line: Tesla’s pricing strategy is a high-stakes gamble on future cost improvements. If Gigafactory efficiencies don’t materialize in FY2024-2025, margin compression will continue. The scenario analysis shows that for every 1% price change, Tesla’s EBITDA shifts by approximately $1B—a number management must weigh against the incremental volume it generates.
The Business Question
“Was Tesla’s pricing strategy a smart trade-off, or did they leave money on the table?”
| Bear Case | Bull Case |
|---|---|
| ”They’re destroying their brand value" | "Volume drives network effects and FSD adoption" |
| "Margins will never recover" | "Manufacturing cost curve is improving" |
| "They’re in a price war they can’t win" | "They’re gaining market share from legacy OEMs” |
My analysis provides data-driven answers.
Key Findings
The EBITDA Bridge Breakdown (FY2023)
| Component | Impact | Direction |
|---|---|---|
| Prior Year EBITDA | $17.6B | Baseline |
| Volume Effect | +$30.7B | 📈 Strong positive (1.3M → 1.8M units) |
| Price Effect | -$15.4B | 📉 Significant drag (53.5K ASP) |
| COGS Impact | -$18.5B | 📉 Cost headwinds |
| Opex Impact | -$1.7B | 📉 SG&A growth |
| D&A (Non-Cash) | +$0.9B | 📈 Add-back |
| Current EBITDA | $13.6B | Net Result |
The Verdict
Volume gains (+15.4B) and rising costs (-$18.5B).
Despite record deliveries of 1.8 million units, EBITDA declined from 13.6B—a 23% compression year-over-year.
Methodology
1. Data Pipeline (Python)
I built an automated ETL script using yfinance to pull Tesla’s financial statements:
import yfinance as yf
import pandas as pd

ticker = yf.Ticker("TSLA")

# Get Financial Statements
income_stmt = ticker.financials.transpose()
cashflow = ticker.cashflow.transpose()

# Calculate EBITDA = EBIT + D&A
df["EBITDA"] = df["EBIT"] + df["D_and_A"]

# Calculate Implied ASP = Revenue / Deliveries
df["Implied_ASP"] = df["Revenue"] / df["Volume_Units"]
Key Technical Decisions:
- Fuzzy Column Matching: Yahoo Finance column names vary (e.g., “Total Revenue” vs “TotalRevenue”). I built a helper function to handle naming variations gracefully.
- Manual Data Injection: Delivery numbers aren’t in the API—I manually sourced them from Tesla’s Investor Relations.
2. EBITDA Bridge Logic
The waterfall chart decomposes year-over-year EBITDA changes:
EBITDA_Current = EBITDA_Prior
                 + (ΔVolume × Prior ASP × Prior Margin)    [Volume Effect]
                 + (ΔASP × Current Volume)                   [Price Effect]
                 + (ΔCOGS)                                   [Cost Impact]
                 + (ΔOpex)                                   [Opex Impact]
                 + (ΔD&A)                                    [Non-Cash]
3. Scenario Analysis (Power BI Parameters)
The dashboard includes What-If sliders to simulate alternative scenarios:
| Parameter | Range | Use Case |
|---|---|---|
| Price Scenario | -10% to +10% | “What if Tesla only cut prices by 5%?” |
| Volume Scenario | -20% to +20% | “What if demand was 10% weaker?” |
DAX Implementation:
Adjusted_Revenue =
    [Base_Revenue] * (1 + [Price Scenario Value]) * (1 + [Volume Scenario Value])

Adjusted_EBITDA =
    [Adjusted_Revenue] - [COGS] - [Opex] + [D_and_A]
Dashboard Features
A. Revenue Trajectory
Visualizing Volume (bars) vs Average Selling Price (line) to show the trade-off.
- 2021-2022: Rising ASP (60K+) with growing volume
- 2023-2024: Declining ASP ($55K) offset by 2M+ deliveries
B. Profitability Analysis
Three margin metrics tracked over time:
- Gross Margin %: Cost of goods sold efficiency
- EBITDA Margin %: Operating profitability
- Net Margin %: Bottom-line profitability
Key Insight: All three margins compressed from 2022 peaks.
C. Revenue Breakdown (Stacked Bar)
Decomposing revenue into:
- COGS (Cost of Revenue)
- Opex (Operating Expenses)
- EBIT (Operating Income)
D. EBITDA Bridge (Waterfall)
The centerpiece visualization showing exactly where the money went.
Technical Stack
| Component | Technology |
|---|---|
| Data Extraction | Python, yfinance |
| Data Transformation | pandas |
| Visualization | Power BI |
| Scenario Analysis | Power BI What-If Parameters |
| Automation | GitHub Actions (optional) |
Insights for Investors
1. The Price-Volume Trade-Off
For every 2 in volume-driven revenue.
But rising costs ate most of the gains.
2. The Cost Curve Problem
Tesla’s “manufacturing cost reduction” narrative hasn’t materialized in the numbers yet. COGS growth outpaced efficiency gains.
3. Scenario Sensitivity
Using the What-If sliders:
- A 5% higher ASP (less aggressive cuts) would have preserved ~$7B in EBITDA
- But this might have cost 15-20% of volume—net uncertain
Next Steps
- Peer Comparison: Add GM, Ford, Rivian to compare margin structures
- Quarterly Granularity: Break down the bridge by quarter
- Forward Estimates: Integrate analyst consensus for FY2025 projections
Key Takeaways
- EBITDA Bridge is a powerful tool for decomposing financial performance
- Tesla’s pricing strategy delivered volume but compressed margins
- Scenario Analysis enables stakeholders to explore “what-if” questions
- Python + Power BI creates a powerful financial analysis workflow