Mapping Knowledge: Global Library Density & National Wealth Analysis
Engineered a fault-tolerant Python pipeline to map 80,000+ libraries globally, analyzing the correlation between public infrastructure, HDI, and innovation.
Executive Summary
Engineered a fault-tolerant Python pipeline to map 80,000+ libraries globally, analyzing the correlation between public infrastructure, HDI, and innovation.
The Challenge
Does a country’s investment in public libraries correlate with its innovation output? To answer this, I needed to map global library density. However, there is no single global database of libraries.
The technical challenge was significant:
- API Limitations: Querying OpenStreetMap (OSM) for massive countries like China or the USA caused frequent server timeouts (504 errors) and rate-limiting rejections (429 errors).
- Data Fragmentation: Geopolitical data gaps (e.g., missing data for Taiwan) and inconsistent naming conventions (e.g., “Czechia” vs. “Czech Republic”) made merging datasets impossible without intervention.
My Approach
I built a robust “polite scraper” and data pipeline using Python to handle these complexities.
- Fault-Tolerant Architecture: I implemented a double-engine redundancy system. If the primary API node failed, the script automatically switched to a backup node. I also added exponential backoff logic to handle rate limits gracefully.
- Resumable Pipeline: By using
mode='a'(append) for data saving, I ensured the scraper possessed “Idempotency”—if it crashed at the 41st country, it could resume immediately without re-scraping the previous 40. - Data Enrichment “Patches”:
- The Taiwan Patch: Manually injected missing economic data for Taiwan using official government statistics to ensure East Asian analysis was complete.
- The Literacy Patch: Imputed “99.0%” literacy rates for developed nations that no longer report these statistics, correcting a bias that skewed the regression model.
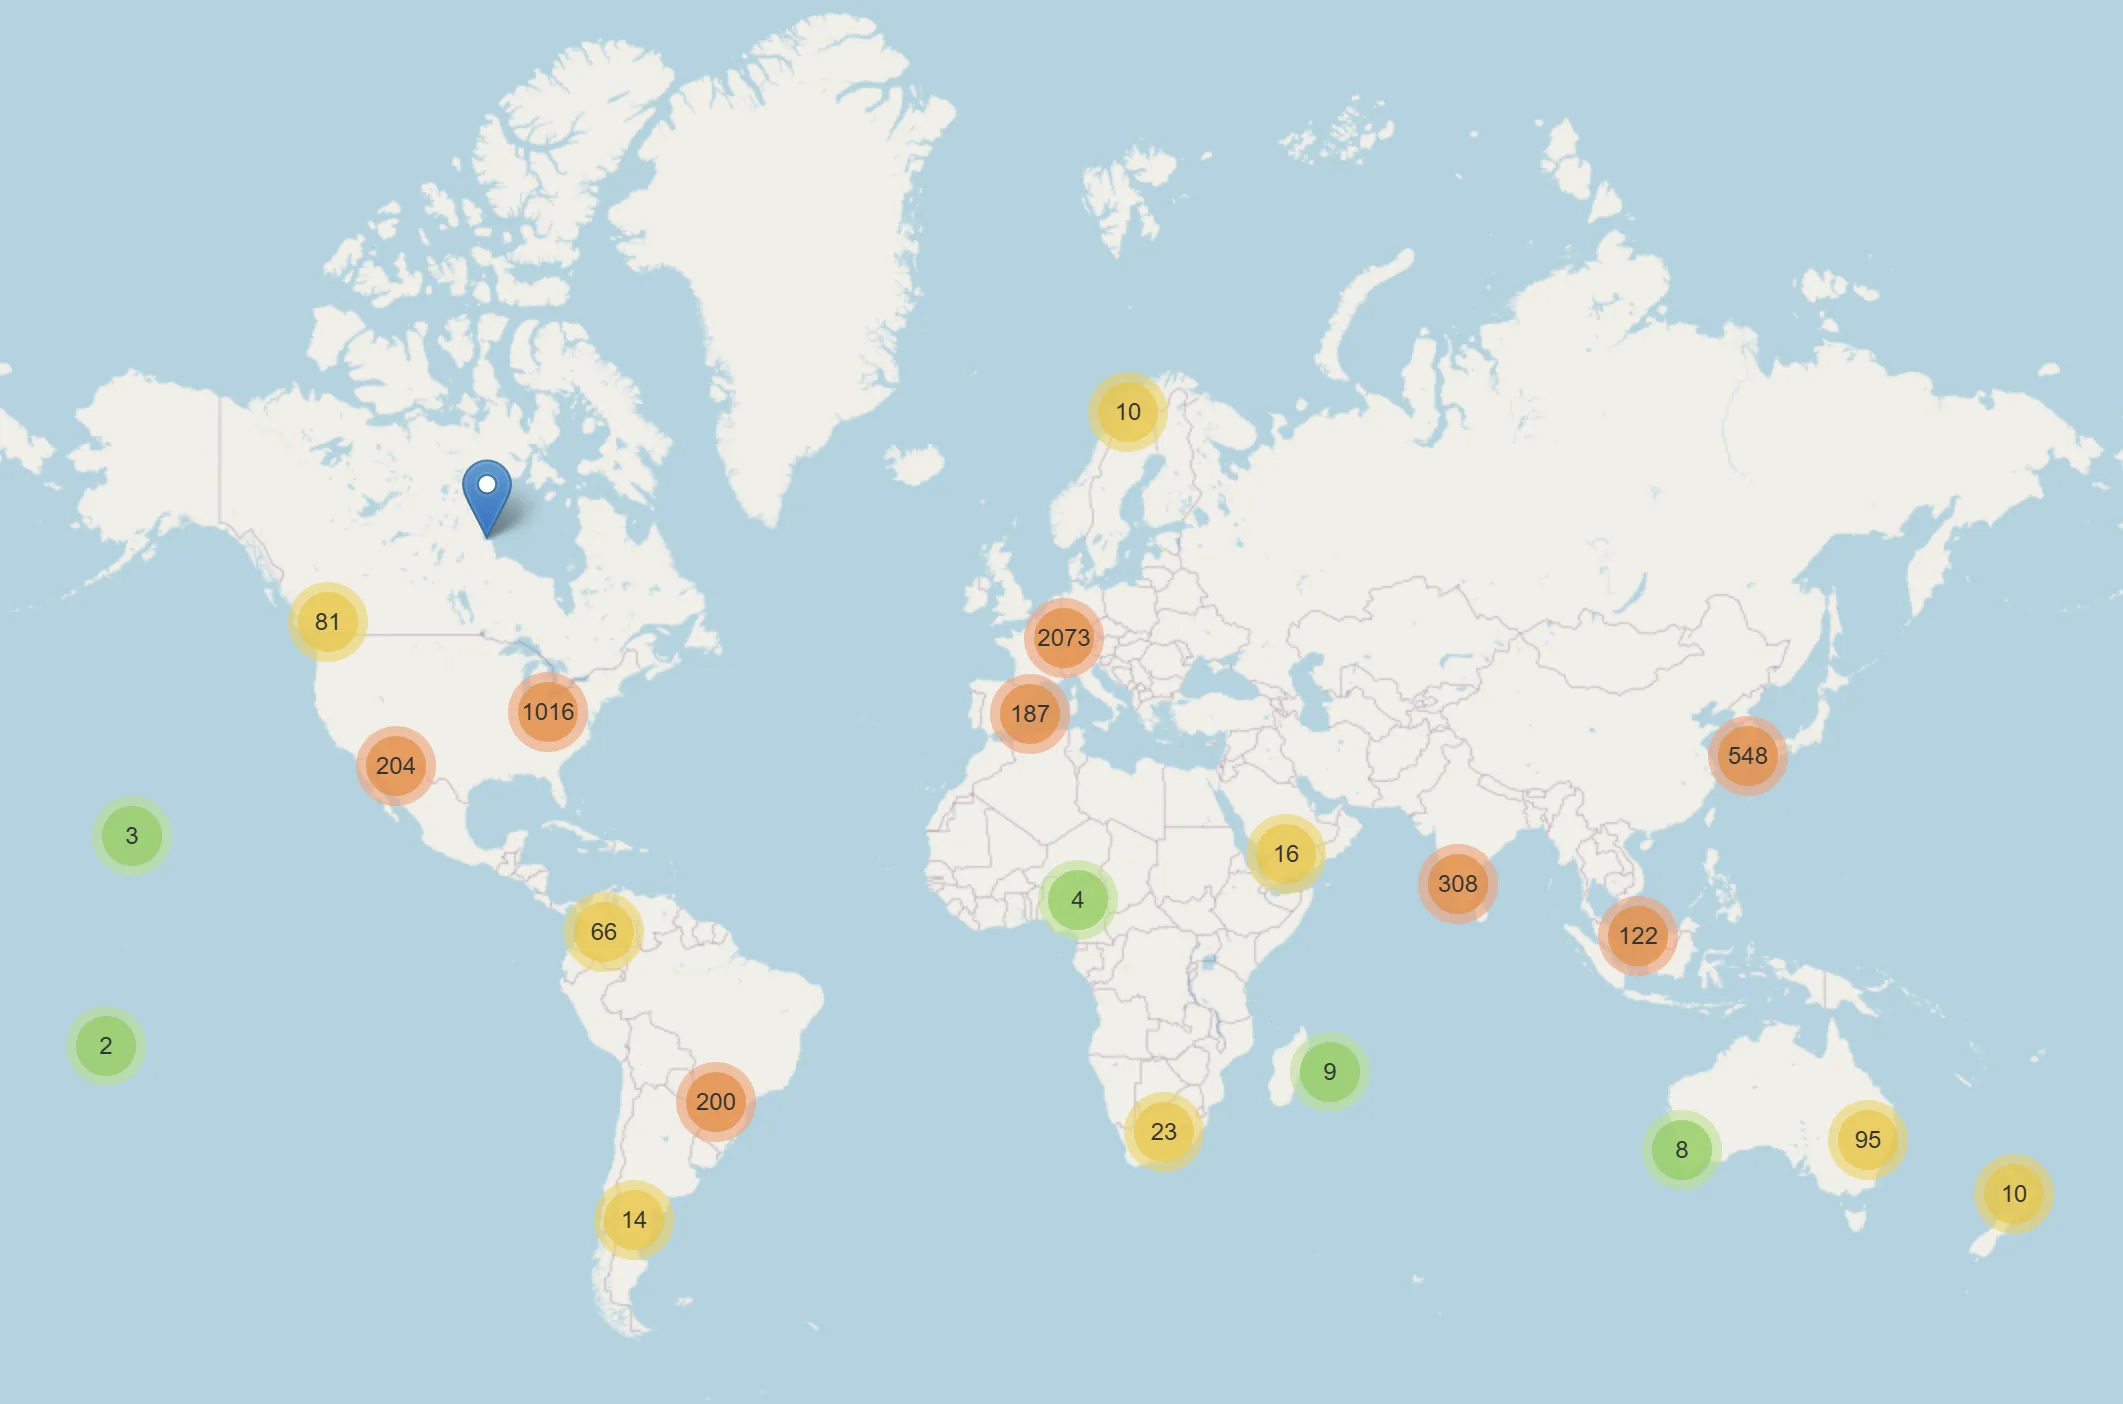
- Verification: Integrated
Foliumto generate interactive HTML maps for immediate visual validation of coordinate accuracy.
Key Insights
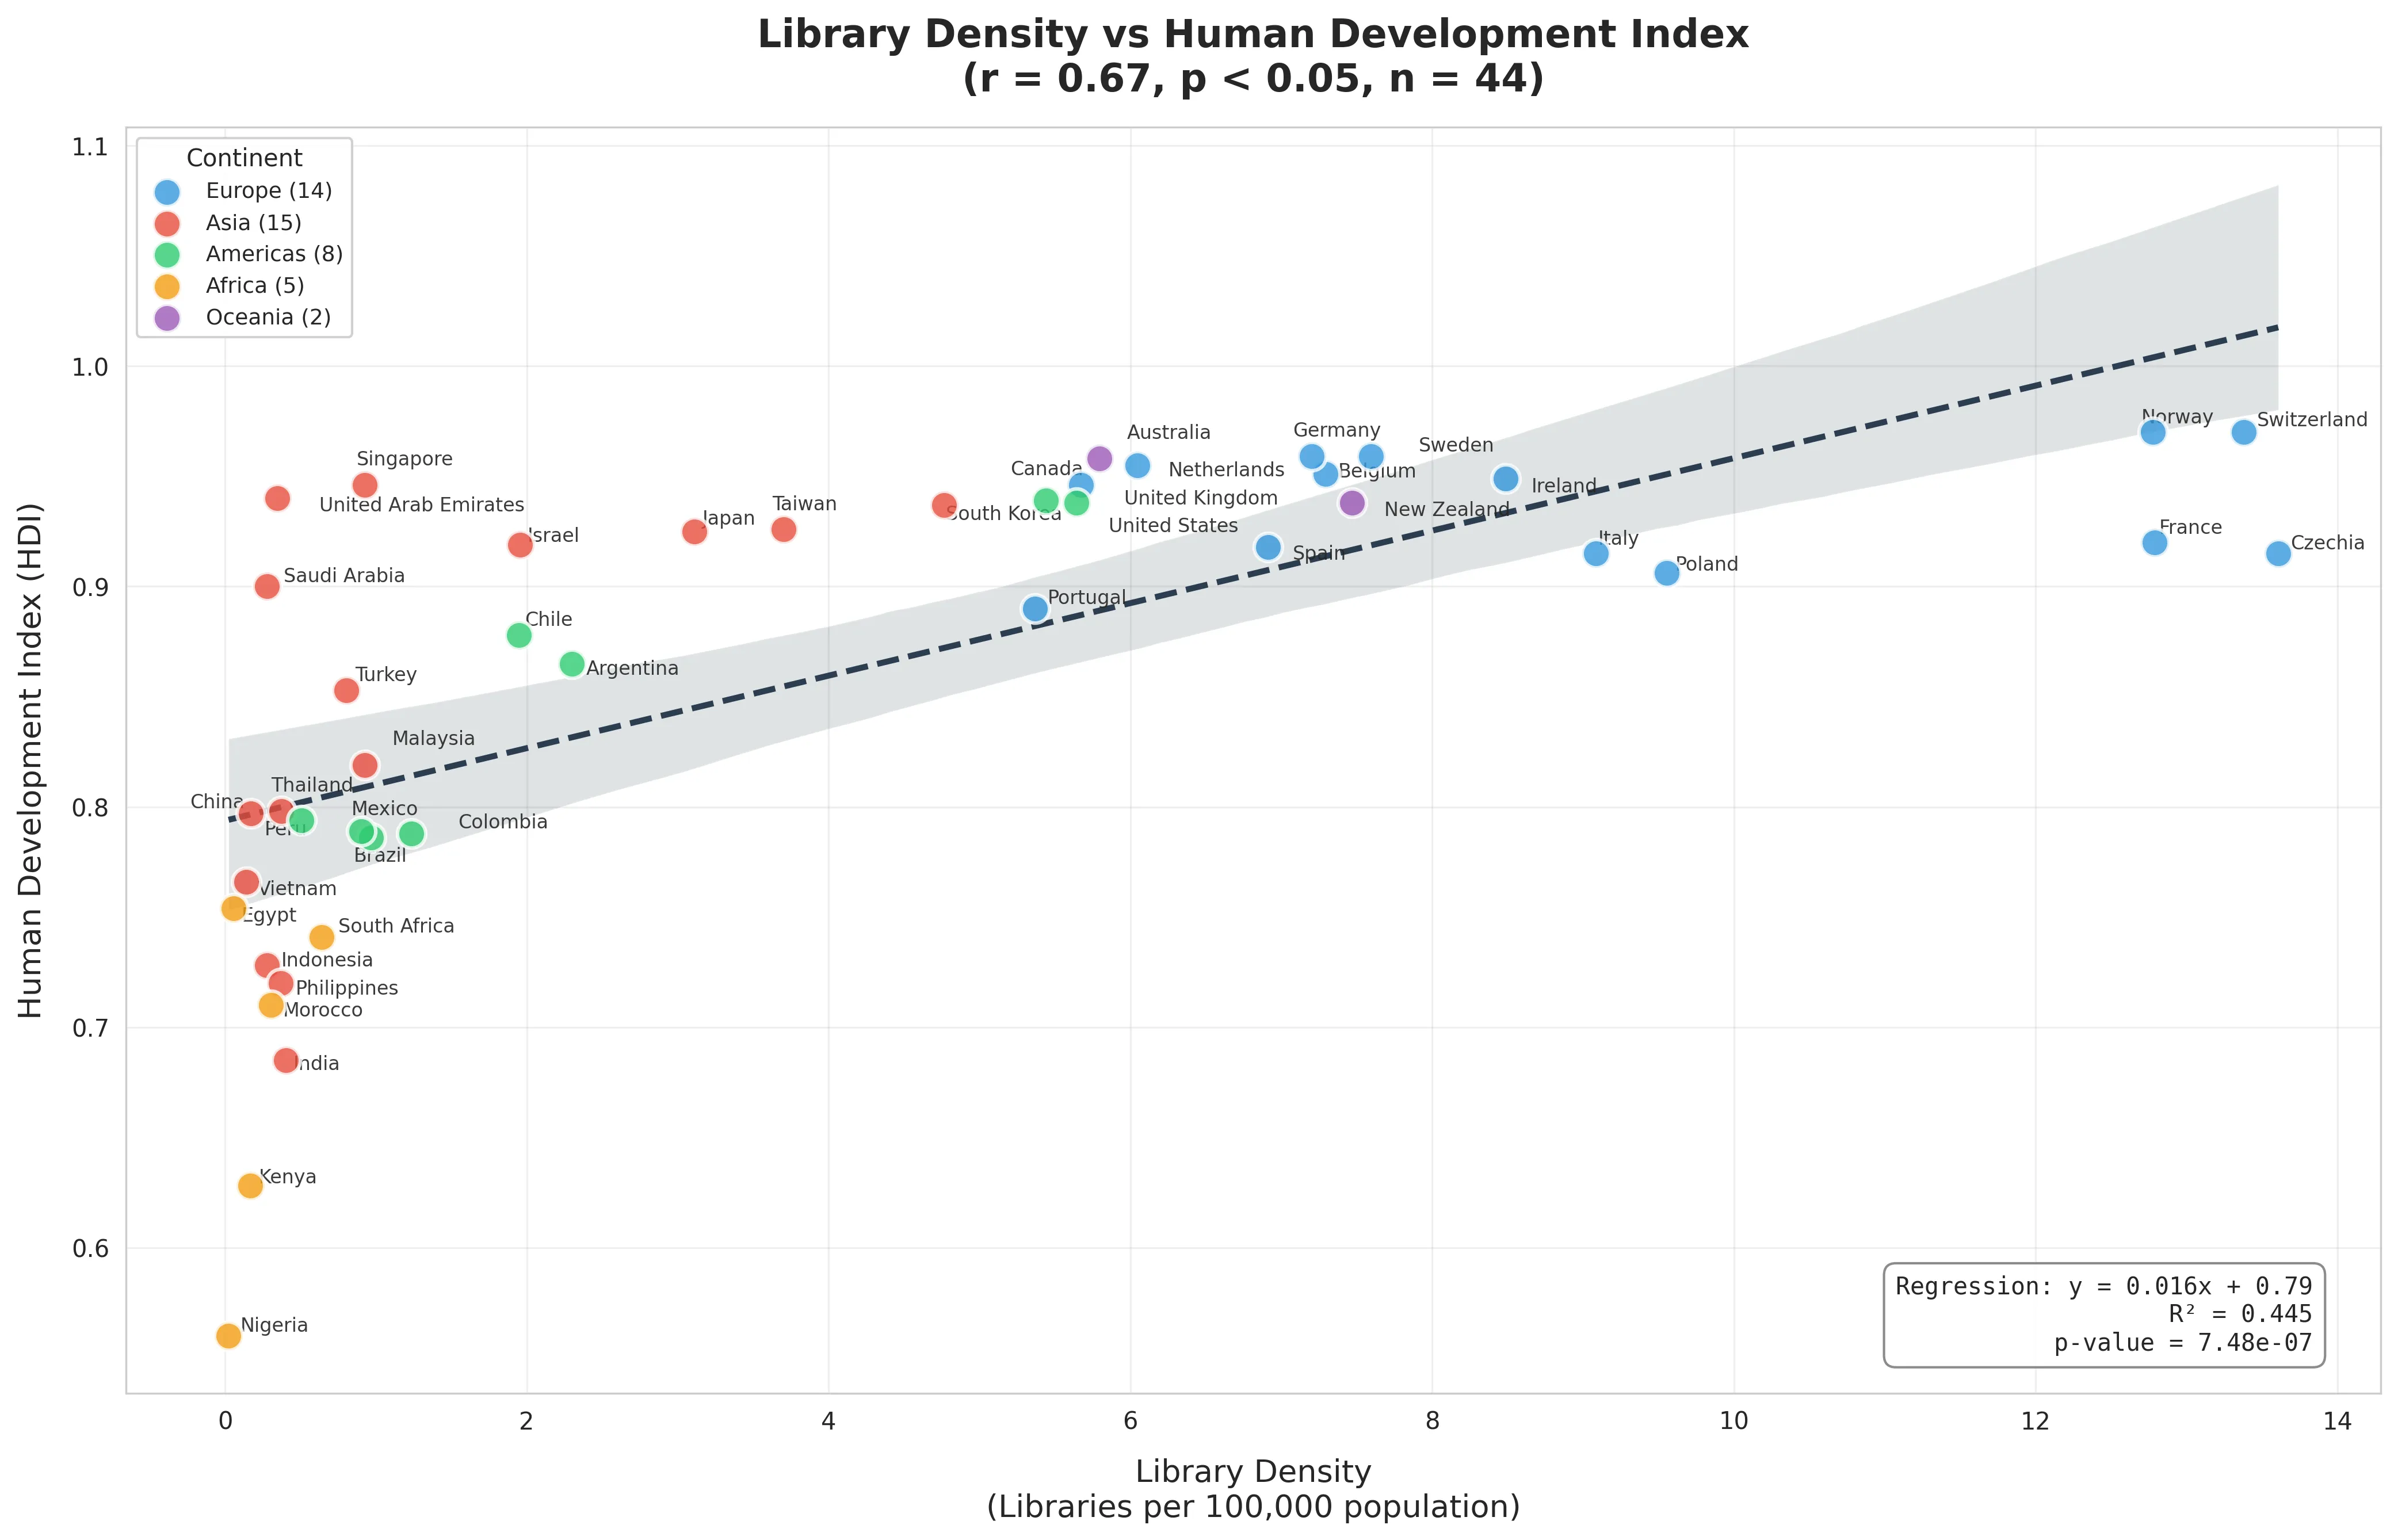
After analyzing over 80,000 data points across 40+ economies, the data revealed distinct cultural models of development.
- Strongest Link with HDI (): Library density is a powerful proxy for a nation’s well-being. The “European Cluster” (e.g., Finland, Czechia) demonstrates that high human development relies heavily on decentralized public infrastructure.
- The “Asian Anomaly”: Tech leaders like Singapore and South Korea show lower per-capita library density despite high innovation. This reflects an urban efficiency model where single large institutions serve dense populations, contrasting with the dispersed European model.
- The Czech Outlier: Historical context matters. Czechia has the world’s highest library density due to a 1919 law mandating libraries in every community, a legacy that persists today.
Gallery