Ownership & Effort: The IKEA Effect, Endowment, and Goal Gradients
The Strange Power of Ownership
Have you ever noticed that things you own seem more valuable? Or that projects you’ve worked on feel more important than objectively better alternatives?
This article explores three interconnected phenomena:
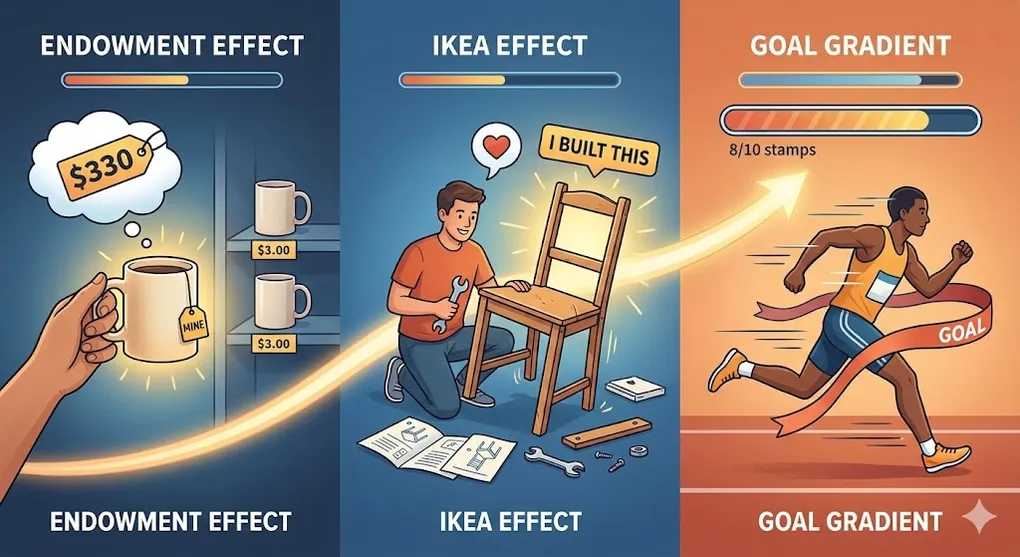
- Endowment Effect: Owning something increases its perceived value
- IKEA Effect: Building something increases its perceived value
- Goal Gradient Effect: Proximity to goals increases motivation
Part 1: The Endowment Effect
The Mug Experiment
In a famous study, researchers randomly gave coffee mugs to half the participants.
| Group | Question | Average Answer |
|---|---|---|
| Owners | ”How much to sell your mug?” | $7.12 |
| Non-owners | ”How much to buy a mug?” | $2.87 |
Same mug. 2.5x price difference.
The only variable: ownership.
Why Does This Happen?
| Explanation | Mechanism |
|---|---|
| Loss Aversion | Selling = losing something you have |
| Psychological Ownership | ”Mine” triggers protective instincts |
| Association | Object becomes linked to our identity |
Real-World Manifestations
| Domain | Effect |
|---|---|
| Real Estate | Sellers consistently overvalue their homes |
| Investing | Reluctance to sell stocks you already own |
| Negotiations | Valuing what you have > what you could get |
| Relationships | ”My” team, “my” company feels special |
The Mere Ownership Effect
Remarkably, ownership doesn’t even need to be real:
| Study | Condition | Result |
|---|---|---|
| Virtual ownership | ”Imagine this is yours for a moment” | Increased valuation |
| Touch | Physically holding an item | Higher willingness to pay |
| Customization | Choose color/configuration | Stronger attachment |
Implication: Free trials, “hold it in your hands,” and customization all trigger ownership psychology before purchase.
Part 2: The IKEA Effect
The Cake Mix Paradox
In the 1950s, instant cake mixes launched with a simple promise: “Just add water.”
Result: They flopped.
Consumers felt the cakes weren’t “homemade.” The solution? Remove the powdered egg.
New instructions: “Add water AND an egg.”
Sales soared. The required effort made consumers feel like bakers.
The Research
Psychologists Norton, Mochon, and Ariely demonstrated this empirically:
| Condition | Valuation |
|---|---|
| Pre-assembled IKEA box | $0.48 |
| Self-assembled IKEA box | $0.78 |
| Professional’s assembly | $0.63 |
Key insight: Amateurs valued their own (often inferior) creations MORE than professional work.
Why Effort Creates Value
| Mechanism | Explanation |
|---|---|
| Effort Justification | ”I worked hard, so it must be good” |
| Competence Signaling | ”I built this” enhances self-image |
| Emotional Investment | Time spent creates attachment |
| Completion Satisfaction | Finishing triggers dopamine |
Business Applications
| Strategy | Implementation |
|---|---|
| Customization | Let users configure products |
| Assembly required | Some DIY increases value perception |
| Co-creation | Involve users in product development |
| Onboarding tasks | Early effort investment increases retention |
The IKEA Effect in Digital Products
| Product | IKEA Effect Lever |
|---|---|
| Spotify | Creating playlists |
| Curating boards | |
| Notion | Building your workspace |
| Games | Character customization |
| Social Media | Profile setup, content creation |
The Switching Cost Implication
Once users invest effort:
- They’ve created value they don’t want to lose (Endowment)
- They’ve built something they’re proud of (IKEA Effect)
- Switching means abandoning their creation
Result: Effort = Retention.
The Dark Twin: Sunk Cost Fallacy
The IKEA Effect has a shadow side: Sunk Cost Fallacy.
| IKEA Effect (Positive Framing) | Sunk Cost Fallacy (Negative Framing) |
|---|---|
| “I invested effort, so I love it" | "I invested too much to quit now” |
| Attachment through creation | Attachment through entrapment |
| Stays because of pride | Stays because of loss aversion |
| Enhances perceived value | Prevents rational exit |
They are two sides of the same coin:
IKEA Effect: “I built this playlist over 3 years. It’s mine.”
Sunk Cost: “I’ve spent 500 hours on this game. I can’t quit now—even though I hate it.”
For retention, both are powerful. But ethically, there’s a line:
| Ethical Use | Exploitative Use |
|---|---|
| Help users build something they genuinely value | Trap users with accumulated effort they can’t export |
| Make invested effort portable (export data) | Lock-in through artificial switching costs |
| Celebrate their creations | Guilt-trip about “losing all your progress” |
The Test: Is your user staying because they love what they built, or because they fear losing what they invested?
Part 3: Goal Gradient Effect
The Coffee Card Experiment
Researchers gave customers one of two coffee loyalty cards:
| Card | Stamps Needed | Stamps Given | Stamps Remaining |
|---|---|---|---|
| A | 10 | 0 | 10 |
| B | 12 | 2 (gifted) | 10 |
Mathematically identical. Both need 10 more stamps.
Result: Card B was completed 34% faster.
Why Progress Illusion Works
| Factor | Effect |
|---|---|
| Perceived progress | 2/12 (17%) feels like a head start |
| Sunk cost | ”Already invested, might as well finish” |
| Goal proximity | Closer to goal = higher motivation |
| Endowed progress | Gifted stamps feel “earned” |
The Acceleration Pattern
As people approach their goal, motivation accelerates:
Distance to Goal:  Far ----→ Near
Effort Invested:   Low ----→ High
Purchase Frequency: Low ----→ High
Engagement:        Low ----→ High
Applications in Product Design
Loyalty Programs
| Basic Design | Optimized Design |
|---|---|
| ”Earn 10 points for reward" | "You have 2/12 points toward reward!” |
| Empty progress bar | Pre-filled 15% |
| Points only after purchase | Bonus points for signup |
Onboarding
| Basic Design | Optimized Design |
|---|---|
| ”Complete 5 steps" | "Step 2 of 6 (you’ve started!)” |
| Unmarked checklist | Profile “30% complete” |
| No progress shown | Visual progress bar |
Gamification
| Mechanic | Goal Gradient Application |
|---|---|
| Levels | Short early levels, longer later |
| Achievements | Early wins, visible progress |
| Streaks | Loss aversion + proximity (“Keep your streak!”) |
| Leaderboards | Show how close you are to next rank |
Detecting Goal Gradient in Data
def analyze_goal_gradient(user_activity_df, goal_column='progress_percent'):
    """
    Detect acceleration as users approach goals.

    Parameters:
    - user_activity_df: DataFrame with user actions and progress
    - goal_column: Column indicating % progress to goal
    """

    # Bin progress into deciles
    user_activity_df['progress_bin'] = pd.cut(
        user_activity_df[goal_column],
        bins=[0, 20, 40, 60, 80, 100],
        labels=['0-20%', '20-40%', '40-60%', '60-80%', '80-100%']
    )

    # Calculate activity rate per bin
    activity_by_progress = user_activity_df.groupby('progress_bin').agg({
        'actions_per_day': 'mean',
        'session_duration': 'mean',
        'purchase_frequency': 'mean'
    })

    print("Activity by Goal Proximity:")
    print(activity_by_progress)

    # Check for acceleration
    early_stage = activity_by_progress.loc['0-20%', 'actions_per_day']
    late_stage = activity_by_progress.loc['80-100%', 'actions_per_day']

    acceleration_ratio = late_stage / early_stage

    print(f"\nGoal Gradient Acceleration: {acceleration_ratio:.2f}x")

    if acceleration_ratio > 1.5:
        print("✅ Strong goal gradient effect detected")
    else:
        print("⚠️ Weak gradient - consider adding progress visibility")

    return activity_by_progress
Combining All Three Effects
The most effective engagement strategies layer these effects:
Case Study: Duolingo
| Effect | Implementation |
|---|---|
| Endowment | ”Your streak,” “Your progress” |
| IKEA Effect | Building your personal course path |
| Goal Gradient | XP bars, level progress, “5 more to unlock!” |
Case Study: LinkedIn
| Effect | Implementation |
|---|---|
| Endowment | ”Your profile,” “Your network” |
| IKEA Effect | Profile completion, content creation |
| Goal Gradient | ”Profile strength” meter, “87% complete” |
Design Framework
1. Create Ownership
   - Personalization options
   - "Your" language throughout
   - Free trial / touch opportunity

2. Require Effort
   - Onboarding tasks
   - Customization steps
   - Content creation features

3. Show Progress
   - Visual progress bars
   - Milestone celebrations
   - "Almost there!" messaging
Summary
| Effect | Mechanism | Application |
|---|---|---|
| Endowment | Ownership increases perceived value | Trials, “your” language, personalization |
| IKEA Effect | Effort increases perceived value | DIY elements, customization, co-creation |
| Goal Gradient | Proximity increases motivation | Progress bars, head starts, milestones |
The Retention Formula
Further Reading
- 📄 Norton, Mochon & Ariely (2012). The IKEA Effect. Journal of Consumer Psychology.
- 📄 Kivetz, Urminsky & Zheng (2006). The Goal-Gradient Hypothesis Resurrected. Journal of Marketing Research.
- 📖 Predictably Irrational — Dan Ariely
- 📖 Hooked — Nir Eyal