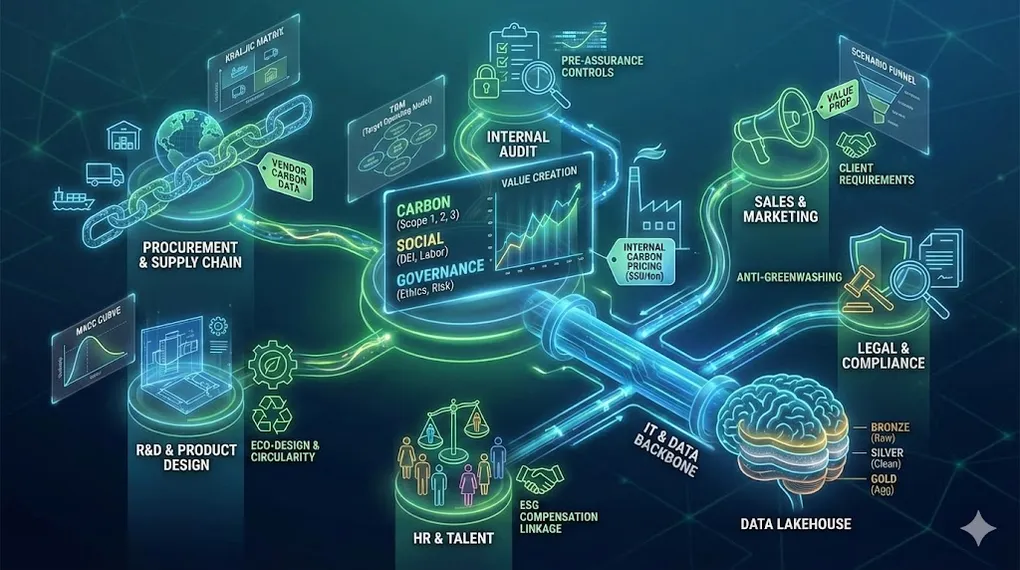
ESG Cross-Functional Impact: Departments, Strategy Models, and Data Engineering
With ISSB and stricter regulations (EU CBAM, CSDDD) coming into force, ESG has evolved from a “sustainability office” function to an “all-hands-on-deck” company-wide imperative.
If the financial statements are the scoreboard, then every department is a player on the field, either scoring or losing points. Finance can calculate all it wants, but if Procurement can’t source low-carbon materials and R&D can’t develop energy-efficient products, the final scorecard will still look bad.
Part 1: The Six Departments Most Impacted by ESG
1.1 Procurement & Supply Chain — The Scope 3 Gatekeepers
Impact Level: 🔴 Highest
This is the most pressured department during ISSB adoption and decarbonization efforts.
New Reality: Previously evaluated suppliers on “price, delivery, quality.” Now there’s a fourth criterion: carbon data.
| Change Area | What It Means |
|---|---|
| Supplier Screening | Must require carbon footprint data from suppliers. Non-compliant long-term partners may need to be replaced |
| Contract Negotiation | Supplier Code of Conduct clauses requiring emission reduction commitments and human rights compliance |
| Logistics Planning | Reducing transport emissions may require modal shifts (air → sea) or warehouse network redesign |
The Pain Point: Suppliers (especially SMEs) either can’t provide data or provide poor-quality data. Procurement becomes a “data collection agency” chasing reluctant vendors.
1.2 R&D & Product Design — Decarbonization at the Source
Core Driver: Eco-design
ISSB requires disclosure of “transition plans.” If your products are inherently high-emission, the company has no future.
| Change Area | What It Means |
|---|---|
| Material Substitution | Finding recycled or bio-based materials to replace virgin plastics—requires extensive testing |
| Design for Disassembly | Products must be easy to repair and recycle (circular economy compliance) |
| Energy Efficiency | Use-phase emissions (Scope 3 Category 11) are often the largest. “Power savings” becomes a core R&D KPI |
The Pain Point: Sustainable materials are usually more expensive or have inferior properties. R&D must painfully balance cost, performance, and sustainability.
Hardware Manufacturing Reality (Taiwan Context): Dell, HP, Apple now require not just green power at factories, but specific PCR (Post-Consumer Recycled) material percentages in products. R&D must ensure recycled materials can pass safety certifications and reliability testing—a significant engineering challenge.
1.3 Human Resources — Governance and the Talent War
Key ISSB Trigger: IFRS S1 explicitly asks: “Is executive compensation linked to sustainability performance?”
| Change Area | What It Means |
|---|---|
| Performance Metrics | 10-20% of executive bonuses may depend on “emission reduction target achievement” or “employee turnover rate” |
| DEI Disclosure | Must track and disclose gender pay gap, female leadership ratio, employees with disabilities |
| Talent Attraction | Gen Z talent heavily weighs company ESG image. ESG becomes core to employer branding |
The Pain Point: How do you quantify “Social” (S) metrics and tie them to bonuses? What weight should “employee satisfaction” carry? These debates get heated.
1.4 IT & Digital — The Data Infrastructure Backbone
Reality Check: ESG data used to live in scattered Excel files. Now it needs to be in the ERP.
| Change Area | What It Means |
|---|---|
| System Integration | Connect electricity bills, water bills, travel records, waste manifests to carbon management platforms |
| Audit Trail | Data must be immutable and traceable for assurance purposes. Every emission data point needs a source document |
| Cybersecurity | Now considered a Governance (G) issue—cyber vulnerabilities are material ESG risks |
The Pain Point: Classic “dirty work.” Data sources come in messy formats (PDFs, handwritten notes). Standardization is a nightmare.
1.5 Legal & Compliance — The Greenwashing Defense Line
New Risk: With anti-greenwashing regulations (EU Green Claims Directive) taking effect, misleading statements carry real penalties.
| Change Area | What It Means |
|---|---|
| Advertising Review | Marketing wants to say “100% eco-friendly.” Legal must demand evidence (ISO certification) before approval |
| Contract Review | Clarify carbon credit ownership, breach liabilities in supplier/customer agreements |
| Board Responsibility | Ensure directors understand their fiduciary duty regarding climate risk |
The Pain Point: Legal often becomes the “brake pedal” blocking Marketing’s exaggerated claims, creating cross-departmental tension.
1.6 Sales & Marketing — Client Requirements as License to Operate
B2B Reality: Without an ESG report, you may not even qualify to bid.
| Change Area | What It Means |
|---|---|
| Bid Qualification | Apple, Microsoft, TSMC require suppliers to commit to renewable energy. Sales must understand these requirements to win contracts |
| Product Carbon Footprint | Customers demand PCF for individual products. Sales coordinates with R&D and Manufacturing to calculate |
| Brand Premium | Marketing must convert “low carbon” into “high value” that customers will pay more for |
The Pain Point: Customer requirements are wildly varied—some want CDP, others want EcoVadis. Sales exhausts itself filling questionnaires.
1.7 Internal Audit — The Pre-Assurance Gatekeeper
Why Often Overlooked: Many companies focus on Legal/Compliance but forget that ISSB reports require third-party assurance.
| Change Area | What It Means |
|---|---|
| Internal Controls | Must establish controls over ESG data before external auditors arrive |
| Process Documentation | Every data point needs traceable SOPs (who collected it, when, how) |
| Readiness Assessment | Internal audit must test whether the organization can produce assurance-ready data |
The Pain Point: Internal audit teams trained in financial controls suddenly need to understand carbon accounting, emission factors, and Scope 3 estimation methodologies.
Part 2: Cross-Functional Collaboration Matrix
| Department | ESG Keyword | Core Task | One-Sentence Change |
|---|---|---|---|
| Finance | Capital Allocation | Calculate climate risk impact on financials | ”Not just managing money—managing carbon accounts too” |
| Procurement | Supply Chain Engagement | Collect supplier carbon data, purchase green power | ”Not just comparing prices—comparing emissions” |
| R&D | Eco-design | Develop low-carbon, recyclable products | ”Think about disposal during design” |
| HR | Compensation Linkage | Tie ESG targets to executive bonuses | ”Miss carbon targets, bonus gets cut” |
| IT | Digital Transformation | Build automated carbon accounting systems | ”Throw away Excel, automate the data” |
| Legal | Anti-Greenwashing | Verify all sustainability claims | ”No evidence, no ‘we’re eco-friendly’ claims” |
| Sales | Customer Requirements | Respond to ESG RFPs and questionnaires | ”No ESG report, no contract” |
| Internal Audit | Pre-Assurance Controls | Build ESG internal controls before external verification | ”If we can’t audit it internally, PwC will tear us apart” |
The Hardest Part: The biggest challenge in ESG integration isn’t technology—it’s communication across silos.
The “Clay Layer” Problem: Middle Management Resistance
Top executives want ESG. Junior employees support ESG. But middle managers—carrying quarterly KPIs (cost reduction, efficiency)—often see ESG as “creating trouble.”
| The Symptom | The Root Cause |
|---|---|
| Procurement manager keeps buying cheaper (higher-carbon) suppliers | KPI is 100% “Cost Down”—no weight on emissions |
| Factory manager resists process changes | Bonus tied to output volume, not carbon intensity |
| R&D leader delays sustainable material adoption | Time-to-market KPI doesn’t reward eco-design |
The Fix: If procurement manager’s KPI is still 100% cost-focused, they will never buy low-carbon but more expensive materials. ESG transformation requires KPI weight rebalancing at every level.
The Secret Weapon: Internal Carbon Pricing (ICP)
How do you make a factory manager care about emissions? Charge them for it.
By implementing a “Shadow Price” on carbon (e.g., $50/ton) in internal management accounts, high-carbon projects suddenly look less profitable.
| Scenario | Old Machine (High-Carbon) | Green Machine (Low-Carbon) |
|---|---|---|
| Before ICP | OPEX: $100K/year | OPEX: $120K/year |
| ROI: 5 years. Rejected. | ||
| After ICP ($50/ton) | OPEX: 30K carbon charge = $130K | OPEX: 5K carbon charge = $125K |
| ROI: 3 years. Approved. |
Why This Works: ICP is Finance’s most direct tool for influencing other departments. When carbon has a price on the internal P&L, procurement and operations managers automatically start optimizing for emissions—no moral persuasion required.
Part 3: Strategic Models — The Consultant’s Toolkit
When management consultants help companies with ESG transformation, they deploy a consistent set of frameworks.
3.1 MACC (Marginal Abatement Cost Curve) — Net-Zero Pathway Planning
Problem It Solves: You have 100 decarbonization options (change lightbulbs, buy green power, carbon capture, retrofit processes). Budget is limited. Which do you do first?
What It Looks Like: A bar chart ordered from left to right
| Axis | Meaning |
|---|---|
| X-Axis (Width) | Abatement potential (tons CO2 reduced) |
| Y-Axis (Height) | Abatement cost ($ per ton) |
How Consultants Use It:
| Zone | Interpretation | Recommendation |
|---|---|---|
| Negative Cost (below zero) | “Low-hanging fruit”—projects that save money (e.g., LED lighting) | Do immediately |
| Low Cost | Cheaper than carbon tax price | Include in medium-term plan |
| High Cost | Immature technology (green hydrogen, carbon capture) | Long-term R&D or wait |
Output: Helps CFO calculate ROI per dollar of decarbonization investment.
3.2 ESG Value Driver Tree — Financial Linkage Model
Based On: DuPont Analysis / ROIC Tree adaptation
Problem It Solves: Boss asks: “How exactly does ESG make us money?”
What It Looks Like: A tree diagram decomposing ROIC from left to right
| Value Driver | ESG Connection |
|---|---|
| Revenue Growth | → Green product premium, new market access (EU regulation compliance) |
| Operating Margin | → Energy efficiency savings, reduced waste disposal costs |
| Asset Turnover | → Early disposal of high-emission equipment |
| WACC | → Green financing rate discounts, lower risk premium |
Output: Translates abstract “sustainability” into concrete financial KPIs each department can own.
3.3 Climate Scenario Funnel — Risk Assessment
Based On: TCFD / ISSB Scenario Analysis requirements
Problem It Solves: Too many climate variables over 20 years. How do you forecast financial impact?
What It Looks Like: A funnel opening to the right with three pathways
| Pathway | Scenario | What Gets Assessed |
|---|---|---|
| Path A | 1.5°C (High Transition Risk) | Strict regulations, carbon price surge → Transition costs (carbon tax, technology investment) |
| Path B | >3°C (High Physical Risk) | Business as usual, planet heats → Disaster losses (factory flooding, supply chain disruption) |
| Path C | Chaotic Transition | Policy flip-flopping → Market volatility risk |
Output: Tells the board: “In the worst case, here’s how much we lose.”
3.4 TOM (Target Operating Model) — Organizational Design
Problem It Solves: Everyone says ESG is important, but no one is responsible, or departments point fingers at each other.
What It Looks Like: Roof diagram or onion chart with four layers
| Layer | Key Questions |
|---|---|
| Process | Who collects carbon data? Who reviews? (SOP design) |
| People | Who does CSO report to? Do departments need “Sustainability Ambassadors”? |
| Technology | What carbon accounting system to buy? How does it integrate with ERP? |
| Data | How are metrics defined? (Ties back to GHG Protocol) |
Output: Solves “who does what” and “with what tools.”
3.5 Sustainable Kraljic Matrix — Supply Chain Prioritization
Based On: Classic Kraljic Matrix, green upgrade
Problem It Solves: Thousands of suppliers. Which ones do I target for decarbonization first?
What It Looks Like: 2x2 quadrant
| Axis | Dimension |
|---|---|
| X-Axis | Supply Risk (replaceability) |
| Y-Axis | Spend Volume / Carbon Intensity |
| Quadrant | Description | Strategy |
|---|---|---|
| Strategic High-Carbon | High emissions, irreplaceable (wafer foundry, steel) | Deep engagement—collaborate on R&D |
| Non-Critical High-Carbon | High emissions, replaceable (logistics, packaging) | Mandate standards—switch if non-compliant |
| Low-Carbon Groups | Monitor only | Minimal attention |
Output: Focuses limited procurement resources on suppliers with highest decarbonization ROI.
Part 4: How These Models Connect
┌─────────────────────────────────────────────────────────────────────────┐
│                     THE ESG TRANSFORMATION FLOW                         │
│                                                                         │
│  ┌──────────────────┐                                                   │
│  │ SCENARIO FUNNEL  │   "Scare the boss"                               │
│  │ (Risk Assessment)│   → What's the cost of doing nothing?            │
│  └────────┬─────────┘                                                   │
│           │                                                             │
│           ▼                                                             │
│  ┌──────────────────┐                                                   │
│  │  VALUE DRIVER    │   "Entice the boss"                              │
│  │  TREE (ROI)      │   → How much can we make by doing this?          │
│  └────────┬─────────┘                                                   │
│           │                                                             │
│           ▼                                                             │
│  ┌──────────────────┐                                                   │
│  │   MACC CURVE     │   "Plan the path"                                │
│  │ (Prioritization) │   → Which projects deliver best ROI first?       │
│  └────────┬─────────┘                                                   │
│           │                                                             │
│           ▼                                                             │
│  ┌──────────────────┐                                                   │
│  │   TOM (Org       │   "Execute"                                      │
│  │   Design)        │   → Who does what, with what systems?            │
│  └────────┬─────────┘                                                   │
│           │                                                             │
│           ▼                                                             │
│  ┌──────────────────┐                                                   │
│  │ KRALJIC MATRIX   │   "Supply Chain Focus"                           │
│  │ (Procurement)    │   → Which suppliers to prioritize?               │
│  └──────────────────┘                                                   │
└─────────────────────────────────────────────────────────────────────────┘
Part 5: The Data Analyst’s ESG Nightmare
For Data Analysts and Data Engineers, mandatory ESG reporting (ISSB) represents a data infrastructure disaster and rebuild. Past marketing or financial analytics dealt with clean, structured data from ERP or CRM. ESG data analysis is an entirely different world.
5.1 Data Sources: From Structured to Extremely Fragmented
The “Garbage In” Challenge
| Traditional Analysis | ESG Analysis |
|---|---|
| Sales data from ERP/POS, unified format | Electricity bills (PDF), water bills (paper), supplier questionnaires (Excel), IoT sensor data (JSON), employee travel records (travel agency systems) |
Analyst Pain Point: 80% of time spent on ETL and data cleaning. Only 20% on actual analysis.
New Skills Required:
- OCR (Optical Character Recognition) to automatically read invoices
- Tools: Azure Form Recognizer, AWS Textract, Google Document AI
- NLP (Natural Language Processing) to parse unstructured supplier responses
5.2 Granularity: From Annual Totals to Transaction-Level
The Traceability Requirement
| Past (GRI Era) | Present (ISSB/CBAM Era) |
|---|---|
| Read meter once a year, report total emissions | Need to know: “How much power did this machine use during the hour we produced this one screw?” |
Why Transaction-Level:
- Product Carbon Footprint calculations require per-unit traceability
- Every energy consumption record needs timestamp and geo-tag
- Emission factors vary by time (daytime solar = lower factor) and location
5.3 Calculation Logic: The “Dimension Disaster” of Emission Factors
This is what makes ESG data analysis unique. You’re not just aggregating data—you’re matching coefficients.
The Challenge:
You have 10,000 procurement items (paper, computers, cement...)
     ↓
You need 10,000 corresponding emission factors from external databases
(Ecoinvent, IPCC, GaBi...)
     ↓
Factors change (updated annually), vary by region (China-made ≠ Taiwan-made)
New Skill: Build automated Mapping Tables with Fuzzy Matching algorithms to handle messy item descriptions.
Python Stack for Factor Matching:
# Common libraries for ESG data engineering
import pandas as pd                    # Data cleaning
from fuzzywuzzy import fuzz, process   # String matching for factor lookup
from sklearn.impute import KNNImputer  # Missing data imputation
5.4 Data Imputation: From “Exact” to “Scientific Estimation”
Handling Uncertainty & Proxy Data
| Traditional Finance | ESG Analysis (Scope 3) |
|---|---|
| 1. No guessing. | Supplier won’t give data? ISSB allows—even requires—estimation |
Analyst Tasks:
- Build statistical models to fill data gaps
- Example:
Procurement Spend × Industry Average Factor = Estimated Emissions - Must document methodology and assumptions
- Calculate and tag Data Quality Score for every estimate
5.5 Multi-Dimensional Views: Data Modeling for Dual Reporting
Star Schema Implications
Every electricity consumption record (Fact Table) must link to two dimension tables:
| Dimension | Source |
|---|---|
| Location-Based Factor | National grid average |
| Market-Based Factor | Green energy certificates (RECs) |
BI Tool Challenge: Reports must be able to switch views with one click. This requires careful dimensional modeling in Power BI/Tableau backends.
5.6 The ESG Analyst Tech Stack
| Layer | Traditional Tool | ESG-Required Tool | Purpose |
|---|---|---|---|
| Data Collection | Excel, Email | RPA (Robotic Process Automation) | Auto-scrape utility websites, auto-email suppliers for questionnaire completion |
| Data Warehouse | ERP Database | Sustainability Data Lake | Store unstructured environmental data and emission factor libraries |
| Calculation Engine | SQL, Excel | Python/R (specialized libraries) | Carbon accounting packages for complex unit conversions |
| Visualization | Monthly PDF Report | Real-time Dashboard | Monitor live carbon intensity, trigger alerts when thresholds exceeded |
5.7 The Hardest Question: Climate Scenario Analysis
ISSB’s toughest requirement is climate scenario financial analysis. This is where analysts need to run Monte Carlo Simulations:
| Variable | Range |
|---|---|
| X: Future carbon price (20 years) | 200/ton |
| Y: Extreme weather factory downtime | 0 - 30 days/year |
| Z: Company revenue growth rate | -5% to +15% |
Target Function: Probability distribution of EPS impact
This isn’t
SUM()orAVERAGE()anymore. It requires building probability models.
5.8 The Mindset Shift
ESG transforms data analysis from a “rearview mirror” (analyzing historical financials) into a “windshield” (predicting future risks).
| Old Paradigm | New Paradigm |
|---|---|
| Descriptive: “What happened?” | Predictive: “What could happen?” |
| Clean data, clear answers | Messy data, uncertainty ranges |
| Internal systems only | External databases (emission factors, climate scenarios) |
| Report the past | Model the future |
Part 6: ETL/ELT & Cloud Architecture — The Infrastructure Revolution
ESG data characteristics (unstructured, external sources, audit-required) are fundamentally different from traditional enterprise data (structured, internal, analysis-only). This directly impacts ETL/ELT design logic and cloud architecture decisions.
6.1 ETL vs. ELT: From “Clean Then Store” to “Evidence First”
Traditional BI uses ETL (Extract-Transform-Load): clean data first, then store. But for ESG, because of third-party assurance requirements, ELT (Extract-Load-Transform) has become mandatory—evolving into ELT-L (Extract-Load-Transform-Lineage).
| Aspect | Traditional BI (ETL) | ESG Reporting (ELT + Lineage) | Why |
|---|---|---|---|
| Raw Data Handling | Filter noise, keep only cleaned data | Must preserve original files (Raw Data Preservation) | Auditors demand “original water bill PDF” or “supplier’s raw Excel”—not just cleaned numbers |
| Transform Logic (T) | Hard-coded in scripts or SQL | Versioned and traceable | Emission factors update annually. You must explain “why 2023 used this factor, 2024 used that” |
| Error Handling | Overwrite after correction | Immutable + correction log | Once data is published, corrections must leave an audit trail—no silent overwrites |
6.2 The Medallion Architecture (Bronze-Silver-Gold)
ESG data pipelines typically enforce the Databricks Medallion Architecture:
┌─────────────────────────────────────────────────────────────────────────┐
│                     ESG DATA LAKEHOUSE ARCHITECTURE                     │
│                                                                         │
│  ┌─────────────────┐  ┌─────────────────┐  ┌─────────────────┐         │
│  │  BRONZE (Raw)   │→ │  SILVER (Clean) │→ │   GOLD (Agg)    │         │
│  │                 │  │                 │  │                 │         │
│  │ • Original PDFs │  │ • Unit convert  │  │ • CO2e totals   │         │
│  │ • Raw Excel     │  │   (L→gal)       │  │ • Power BI      │         │
│  │ • IoT JSON logs │  │ • Standardize   │  │   dashboards    │         │
│  │ • IMMUTABLE     │  │   names         │  │ • ISSB reports  │         │
│  └─────────────────┘  └─────────────────┘  └─────────────────┘         │
│         ↑                                                               │
│    AUDIT EVIDENCE                                                       │
│    (Never modify)                                                       │
└─────────────────────────────────────────────────────────────────────────┘| Layer | Content | Rule |
|---|---|---|
| Bronze | Supplier Excel, PDF invoices, IoT raw logs | Immutable—audit evidence |
| Silver | Unit conversions, standardized supplier names | Versioned transformations |
| Gold | Combined with emission factors → final CO2e | Ready for reporting |
6.3 Data Pipeline Fragmentation
Traditional ETL sources are simple: SQL databases (ERP/CRM). ESG sources are a disaster:
| Source Type | Example | Challenge |
|---|---|---|
| IoT Sensors | Smart meters sending JSON every 15 minutes | High volume, real-time ingestion |
| External APIs | Google Maps (logistics distances), climate databases (physical risk) | Rate limits, authentication |
| Web Scraping | Utility company websites for latest emission factors | Fragile, format changes |
| Messy Files | Supplier questionnaires (hand-filled Excel, inconsistent formats) | Requires extensive cleaning |
Impact: Data Engineers must write more custom Python connectors instead of relying on standard SQL connectors.
6.4 The Dimensional Modeling Nightmare
Scenario: You have a purchase record—“100 tons of cement.”
Challenge: You can’t just multiply by a single fixed factor. During ETL, you must dynamically query:
| Question | Why It Matters |
|---|---|
| Where was this cement produced? | Taiwan factor ≠ China factor |
| When was it purchased? | 2023 factor ≠ 2024 factor |
| Did supplier provide a specific factor? | Use supplier-specific if available, else use industry average |
Technical Debt: This creates ETL scripts full of complex IF-ELSE logic and Lookup Joins.
6.5 Data Lineage: From “Nice to Have” to “Must Have”
Previously, Data Lineage was optional. Under ISSB, it’s mandatory.
Requirement: When an auditor clicks on “Scope 3 emissions: 50,000 tons” in your report, the system must draw a path showing which invoices contributed and which emission factor version was used.
Tool Impact: Companies are forced to adopt tools with strong lineage capabilities:
- dbt (data build tool) — Open source, SQL-based transformations with auto-documentation
- Informatica — Enterprise data governance with full lineage tracking
- Apache Atlas — Open-source metadata management
6.6 Cloud Architecture: The Rise of Data Lakehouse
Since ESG requires handling both structured data (ERP) and unstructured evidence (PDF invoices, images):
- Traditional Data Warehouse (structured only) → Not enough
- Pure Data Lake (no governance) → Too chaotic
Result: ESG is a major driver pushing enterprises toward Data Lakehouse architectures.
| Platform | Strength |
|---|---|
| Snowflake | Separation of compute/storage, easy scaling |
| Databricks | Native Medallion architecture, strong ML integration |
| Google BigLake | Unified analytics across formats |
6.7 Cloud ESG Products: Build vs. Buy
All three major cloud providers now offer vertical ESG solutions:
| Provider | Product | Focus |
|---|---|---|
| Microsoft | Cloud for Sustainability | Built on Dataverse, pre-built emission calculation models |
| AWS | Customer Carbon Footprint Tool | Calculates cloud infrastructure’s own carbon emissions |
| Salesforce | Net Zero Cloud | CRM data directly converted to carbon calculations |
Architect’s Dilemma: “Build custom on AWS with Python/SQL” vs. “Buy Microsoft’s SaaS”? Large enterprises typically choose hybrid: self-built Lakehouse at the bottom, SaaS for presentation layer.
6.8 GreenOps: The Meta-Problem
Here’s an ironic loop: Running ETL to calculate carbon emissions also generates carbon emissions.
New Discipline: Similar to FinOps (cloud cost optimization), GreenOps is emerging.
| Practice | Description |
|---|---|
| Carbon-Aware Scheduling | Run heavy ETL batch jobs or AI training during “green power windows” (e.g., midday solar peaks) or in regions with high renewable mix (e.g., hydro-rich regions) |
| Data Lifecycle Management | Delete cold data to reduce storage energy consumption |
| Right-Sizing | Don’t over-provision compute for ETL jobs |
6.9 Recommendations for Data Teams
-
Embrace ELT: Stop thinking “clean first, store later.” Store raw evidence first (Bronze Layer)—it’s your insurance policy for audits.
-
Obsess Over Metadata: Every data point needs tags (source, timestamp, factor version). Otherwise, next year’s recalculation will be a nightmare.
-
Upgrade Your Stack: Excel cannot handle Scope 3’s volume and complexity. Migrate to a modern data stack with version control (Git-based transformations like dbt).
Bottom Line: ESG isn’t just about reports—it’s redefining how enterprises trust their data. For data engineers, this is both a massive workload and a career-defining opportunity to become strategically important.
Conclusion: ESG Is Everyone’s Job Now
The message for 2025 and beyond is clear:
- Finance can’t do it alone—every department contributes to the final ESG score
- Cross-functional alignment is the biggest challenge, not technology or data
- Strategic frameworks help translate ESG from abstract ideals into actionable business plans
The companies that succeed will be those that treat ESG not as a compliance burden, but as an operating system upgrade that touches every function.