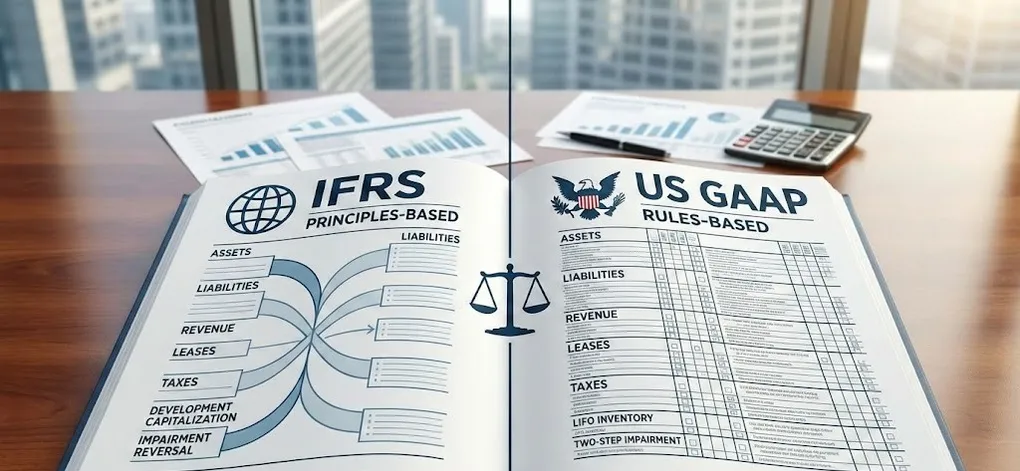
IFRS vs US GAAP: The Definitive Guide for Accountants, Analysts, and CFOs
Imagine explaining to your board why the company’s profit suddenly dropped 15% just because you switched from IFRS to US GAAP. The business didn’t change—the rules did.
For dual-reporting companies, the differences between IFRS and US GAAP aren’t just academic trivia; they are monthly reconciliation nightmares. This article provides a comprehensive, accountant-level comparison across all major areas.
Prologue: Why Do These Standards Exist?
Before diving into the differences, we must first understand why IFRS and US GAAP were created in the first place.
The World Before Standards
Before standardized accounting, every business owner kept their own rulebook:
- Some counted cash only when it hit the bank (Cash Basis)
- Others counted revenue the moment a contract was signed (Accrual Basis)
- Some capitalized everything; others expensed everything
The Pain Points:
| Problem | Description |
|---|---|
| Investor Manipulation | Before the 1929 Great Depression, companies could report however they pleased. 1,000 through creative accounting |
| Apples vs. Oranges | How can an investor compare TSMC and Intel if “profit” means different things in each country? |
| Trust Vacuum | Without common rules, capital markets couldn’t function efficiently |
The Core Insight
IFRS and GAAP weren’t created for “bookkeeping.” They were created to reduce the cost of trust. They are translation protocols—forcing everyone to speak the same financial language so capital markets can operate.
First Principles: What Are They Actually Measuring?
Peel away the thousands of pages of regulations, and both frameworks are trying to capture a single core concept: Economic Substance.
The Fundamental Contradiction of Accounting
Cash is fact. Profit is opinion. IFRS and GAAP are rigorous logic systems attempting to standardize “opinion” so it approaches “fact.”
The Soul of Modern Accounting: Accrual
This is the most deeply “encapsulated” concept—one that most people use without truly understanding.
Intuitive Understanding (Outside the Box):
“I sold something and got money. That’s income.”
The Underlying Principle (Inside the Box):
Cash flow and value creation are misaligned in time.
Example: Gym Membership
| Event | Cash Basis | IFRS/GAAP (Economic Substance) |
|---|---|---|
| Customer pays $36,000 for 3-year membership | Revenue: $36,000 | Revenue: $0. This is a liability (contract liability)—you owe the customer 3 years of service |
| Each month of service delivered | — | Revenue: $1,000 (1/36 recognized) |
All the complex rules (IFRS 15 revenue recognition, IFRS 16 leases) exist to prevent management from exploiting this timing mismatch to inflate earnings.
Two Philosophies of “Encapsulation”
Both frameworks share the same goal but differ in their approach to standardization.
| Aspect | US GAAP | IFRS |
|---|---|---|
| Philosophy | Rules-Based (American legal culture: minimize lawsuit risk) | Principles-Based (European professional culture: trust expert judgment) |
| Style | ”If A occurs and B > 50%, then do C." | "Reflect the economic substance of the transaction.” |
| Advantage | Clear. Follow the steps = safe. | Hard to exploit loopholes. |
| Disadvantage | Easy to game the rules. Design a transaction where B = 49.9% and you avoid C. (This is why Wall Street financial engineering thrived—see Enron) | Heavily dependent on judgment. Junior accountants struggle to know when a “principle” applies. |
The Enron Lesson
Enron exploited US GAAP’s rules-based nature masterfully. They structured transactions to technically comply with specific rules while completely violating the economic substance. This led to post-Enron reforms (SOX) and reinforced IFRS’s principles-based approach as a counterweight.
The Expert Mindset: Three Key Shifts
To truly master IFRS and GAAP, you need to shift from tool-level thinking to principle-level thinking.
Shift 1: From “How do I book this?” to “What’s the story of this transaction?”
| Level | Approach |
|---|---|
| Tool-Level (Invoice Processor) | See invoice → Find account code → Enter |
| Principle-Level (Expert) | Ask: “Did we actually sell this? Or are we just lending it for someone else to sell?” If risk remains with us, IFRS 15 says we cannot recognize revenue—even if the invoice is issued |
The Key: Don’t just look at the invoice. Read the contract. The principle of risk transfer overrides the mechanics.
Shift 2: Balance Sheet > Income Statement
Many recent standard changes (IFRS 16 Leases, IFRS 9 ECL) share a common theme: surfacing hidden obligations.
| Before (Old Mindset) | After (New Mindset) |
|---|---|
| “Rent is just an expense—put it in the P&L" | "We’re using an asset. We owe money. That’s both an asset AND a liability on the balance sheet." |
| "It’s off-balance-sheet, so it doesn’t count" | "If you control a resource and have an obligation, it must be visible” |
The Key: The balance sheet is closer to economic reality than the income statement. Standards evolve to force honesty, not complexity.
Shift 3: Treat Standards as Business Language, Not Legal Text
When asked about a standard, don’t just cite it—explain the business logic.
| ❌ Robotic Answer | ✅ Expert Answer |
|---|---|
| ”Per IFRS 9, we must perform impairment testing." | "To reflect the risk that we might not collect this money, we need to provide early warning. Otherwise, investors see inflated profits." |
| "ASC 842 requires us to capitalize this lease." | "We’re using this building for 10 years and committed to $2M in payments. That’s not just ‘rent’—it’s a financing arrangement wearing a costume.” |
The Key: Standards are business storytelling tools, not legal hoops to jump through.
Part 1: Core Philosophy Differences
Before diving into specifics, understanding the fundamental philosophical divide is essential.
| Aspect | US GAAP | IFRS |
|---|---|---|
| Approach | Rules-Based | Principles-Based |
| Volume of Guidance | ~25,000+ pages | ~2,500 pages |
| Professional Judgment | Less required (explicit rules) | More required (interpret principles) |
| Standard Setter | FASB | IASB |
| Adoption | Primarily United States | 140+ jurisdictions |
What Does This Mean in Practice?
- US GAAP: Accountants look for a specific rule. If there’s no rule, there may be no answer.
- IFRS: Accountants apply broad principles to the specific situation. More room for interpretation, but also more responsibility.
The Cooking Analogy
Think of it like cooking:
- US GAAP (Rules-Based) is a strict recipe: “Bake at 350°F for 45 minutes exactly.” If you follow it, you’re safe.
- IFRS (Principles-Based) is a master chef’s instruction: “Bake until golden brown and firm to the touch.” It relies on your judgment, but if you burn it, it’s on you.
Part 2: Financial Statement Presentation
| Item | US GAAP | IFRS |
|---|---|---|
| Balance Sheet Order | Liquidity decreasing (current assets first) | No requirement (most use liquidity increasing) |
| Extraordinary Items | Prohibited | Also prohibited |
| Other Comprehensive Income (OCI) | Can be combined with or separate from income statement | Must be presented separately |
| Statement of Changes in Equity | Can be in notes | Must be a primary statement |
Part 3: Assets
3.1 Inventory
| Topic | IFRS | US GAAP |
|---|---|---|
| LIFO Allowed? | ❌ Prohibited | ✅ Allowed (LIFO, FIFO, Weighted Average) |
| Write-down Reversal | ✅ Allowed (up to original cost) | ❌ Prohibited. Once written down, new cost basis is established |
Why LIFO Matters
In inflationary environments, LIFO reduces taxable income (matching recent high costs against revenue). US companies use LIFO for tax benefits, but this creates a major reconciliation issue for dual reporters.
The LIFO Conformity Rule (IRS)
Why do US companies “die on this hill”? It’s not just an accounting choice—it’s a legal requirement. Under US tax law, if you use LIFO for tax purposes, you must also use LIFO for financial reporting (IRC §472(c)). This means:
- Companies can’t use LIFO for tax savings and FIFO for prettier financials
- Switching away from LIFO triggers immediate taxation of the entire LIFO reserve
- This regulatory lock-in explains why LIFO persists despite IFRS prohibition
3.2 Development Costs
| Topic | IFRS | US GAAP |
|---|---|---|
| R&D Treatment | Research = Expense. Development = Capitalize (if criteria met: technical feasibility, intent to complete, etc.) | Generally expense as incurred (with limited exceptions like software for external use) |
Impact
Tech and pharma companies look very different under each framework. An IFRS company may show higher assets and profits during development phases.
US GAAP Exception: Software Development Costs
The “all R&D is expensed” rule has important exceptions for software:
- Internal-Use Software (ASC 350-40): Costs incurred during the Application Development Stage (after preliminary project stage, before implementation) are capitalized
- Software for Sale (ASC 985-20): Costs incurred after technological feasibility is established are capitalized
This means SaaS companies and software vendors under US GAAP often capitalize significant development costs—contrary to the common misconception. The key difference is when capitalization begins (IFRS: broader “development” criteria; GAAP: narrower “technological feasibility” or “application development stage”).
3.3 Revaluation Model
| Topic | IFRS | US GAAP |
|---|---|---|
| PP&E Revaluation | ✅ Allowed (fair value model as policy choice) | ❌ Prohibited (historical cost only) |
| Intangible Revaluation | ✅ Allowed (if active market exists) | ❌ Prohibited |
3.4 Impairment Testing
| Aspect | IFRS | US GAAP |
|---|---|---|
| Approach | Single-step: Compare carrying value to recoverable amount (higher of fair value less costs to sell OR value in use) | Two-step: 1) Recoverability test (undiscounted cash flows). 2) If failed, compare to fair value. |
| Reversal Allowed? | ✅ Yes (except goodwill) | ❌ No. Impairment is permanent. |
3.5 Expected Credit Losses (Financial Assets / Receivables)
This is one of the most significant recent divergences, especially impactful for banks and companies with long-term receivables.
| Aspect | IFRS (IFRS 9) | US GAAP (ASC 326 - CECL) |
|---|---|---|
| Model | Three-Stage Model | Single Lifetime Model |
| Stage 1 | 12-month expected credit loss | N/A — always lifetime |
| Stage 2 | Lifetime ECL (significant credit deterioration) | N/A — always lifetime |
| Stage 3 | Lifetime ECL (credit-impaired) | N/A — always lifetime |
| Initial Recognition | 12-month ECL only | Lifetime ECL immediately |
What This Means
- CECL (US GAAP): You must estimate and record losses for the entire life of the asset on Day 1. This front-loads loss recognition.
- IFRS 9: You start with 12-month losses and escalate to lifetime only when credit quality worsens.
Impact: US GAAP companies (especially banks) show higher allowances and lower earnings at origination compared to IFRS peers.
Part 4: Liabilities & Equity
4.1 Provisions / Contingencies
| Topic | IFRS | US GAAP |
|---|---|---|
| ”Probable” Definition | >50% likely (“more likely than not”) | Higher threshold (~70-75%, “likely to occur”) |
| Measurement | Best estimate. If range with equal probability → midpoint | If range with equal probability → minimum amount |
Real-World Impact
IFRS companies recognize provisions earlier and at higher amounts than US GAAP counterparts for the same underlying risk.
4.2 Convertible Debt
| Topic | IFRS | US GAAP |
|---|---|---|
| Accounting | Split accounting: Separate conversion option (equity) from debt host | Generally single liability (unless embedded derivative or specific features) |
4.3 Liability vs. Equity Classification
| Topic | IFRS | US GAAP |
|---|---|---|
| Approach | Substance-focused: Equity only if issuer has unconditional right to avoid delivering cash | More complex rules. SEC registrants may use “Temporary Equity” (Mezzanine) for redeemable instruments |
Part 5: Revenue & Expenses
Both frameworks now use similar 5-step models (IFRS 15 / ASC 606), but differences remain.
| Topic | IFRS | US GAAP |
|---|---|---|
| Collectibility Threshold | >50% likely | ~70%+ “probable” |
| Contract Cost Impairment Reversal | ✅ Allowed | ❌ Prohibited |
| Sales Tax Presentation | Must assess principal vs. agent (no policy election) | Policy election to exclude all sales taxes from transaction price (net presentation) |
Part 6: Leases
This is one of the most visible differences post-convergence efforts.
| Topic | IFRS (IFRS 16) | US GAAP (ASC 842) |
|---|---|---|
| Lessee Model | Single model: All leases on balance sheet. P&L shows depreciation + interest (front-loaded expense) | Dual model: Finance leases (depreciation + interest) vs. Operating leases (straight-line single expense) |
| Low-Value Asset Exemption | ✅ Yes (e.g., <$5,000 assets) | ❌ No explicit exemption (rely on materiality) |
| Short-Term Exemption | ✅ ≤12 months | ✅ ≤12 months |
Why This Matters
Under IFRS, all leases hit the income statement front-loaded (higher expense early). Under US GAAP, operating leases have straight-line expense. This affects earnings patterns significantly.
⚠️ Common Pitfall: IFRS 16 Data Collection
Don’t underestimate the data collection effort for IFRS 16. Unlike US GAAP where you can often stick to old operating lease schedules, IFRS demands a full recalculation of interest and depreciation for every lease. If you’re managing hundreds of leases in Excel, be prepared for crashes, version control nightmares, and auditor questions about your discount rate assumptions.
Part 7: Consolidation
| Topic | IFRS (IFRS 10) | US GAAP |
|---|---|---|
| Model | Single control model: Power + variable returns + ability to use power to affect returns | Dual model: 1) VIE model (power + economics). 2) Voting interest model (majority voting rights) |
De Facto Control Under IFRS
IFRS 10 explicitly considers de facto control—situations where an investor controls without majority voting rights. For example:
- Company A holds 40% of Company B’s shares
- Remaining 60% is held by thousands of small, passive shareholders
- Company A has appointed all board members and makes all key decisions
Under IFRS: Company A likely has de facto control and must consolidate Company B. Under US GAAP: The Voting Interest model typically requires >50% voting rights. Company A would not consolidate (though VIE analysis may apply if B is a VIE).
This can lead to significantly different consolidation scopes for the same corporate structure.
Part 8: Cash Flow Statement
| Topic | IFRS | US GAAP |
|---|---|---|
| Interest Paid | Operating OR Financing (choice) | Operating |
| Interest Received | Operating OR Investing (choice) | Operating |
| Dividends Paid | Operating OR Financing (choice) | Financing |
| Dividends Received | Operating OR Investing (choice) | Operating |
| Bank Overdrafts | Can be component of cash (if integral to cash management) | Must be liability (Financing), cannot offset cash |
Part 9: Income Taxes
| Topic | IFRS (IAS 12) | US GAAP (ASC 740) |
|---|---|---|
| DTA Recognition | Recognize only the amount “probable” (>50%) to be realized | Recognize full amount, then apply Valuation Allowance if realization not probable |
| Tax Rate Used | Enacted or substantively enacted | Enacted only |
| Intra-entity Inventory Transfers | Immediate recognition of deferred tax (buyer’s rate) at transfer | Defer tax effect until sold to third party; seller’s prepaid tax is an asset |
Part 10: Practical Challenges for Dual Reporters
Companies listed on both US and international exchanges (e.g., TSMC, Toyota ADRs) face significant challenges.
Common Pain Points
| Challenge | Description |
|---|---|
| Dual Chart of Accounts | Maintaining parallel ledgers or robust mapping tables |
| Inventory Valuation | LIFO for US tax → Convert to FIFO/Average for IFRS |
| Development Costs | Capitalize under IFRS, expense under GAAP → Track separately |
| Lease Classification | Same lease may be “operating” (US) and “finance-like” (IFRS) → Different P&L patterns |
| Provision Timing | Recognize earlier under IFRS → Reconciliation entries |
| Training | Staff must understand both frameworks deeply |
Reconciliation Approaches
- Primary Framework + Reconciliation Note: Report under one framework, provide reconciliation in footnotes
- Dual Books: Maintain two complete sets of records (expensive but clearest)
- Adjusting Entries: Single primary ledger with period-end adjustments for the alternate framework
Cost Reality
Dual reporting typically adds 10-20% to annual audit and accounting costs. For large multinationals, this can mean millions of dollars annually.
💡 Pro-Tip: ERP Configuration
If you’re setting up an ERP for a dual-reporting entity, do not try to handle GAAP-to-IFRS adjustments manually in spreadsheets. Map the adjustments at the transaction level or account mapping layer if possible. Your future self during audit season will thank you. Nothing is worse than explaining why your reconciliation spreadsheet has 47 tabs and a circular reference.
Part 11: Journal Entry Examples — Side-by-Side Comparison
Understanding the differences conceptually is one thing. Seeing the actual journal entries brings it home.
Example 1: Development Costs
Scenario: Company spends 500,000 on R&D. Of this, 200,000 is research and $300,000 is development (meeting all capitalization criteria).
IFRS Treatment
| Date | Account | Debit | Credit |
|---|---|---|---|
| Year 1 | R&D Expense (Research) | $200,000 | — |
| Development Asset | $300,000 | — | |
| Cash | — | $500,000 | |
| Year 2+ | Amortization Expense | $60,000 | — |
| Development Asset | — | $60,000 |
Development costs capitalized and amortized over useful life (e.g., 5 years)
US GAAP Treatment
| Date | Account | Debit | Credit |
|---|---|---|---|
| Year 1 | R&D Expense | $500,000 | — |
| Cash | — | $500,000 |
All R&D expensed immediately
Impact: IFRS shows higher Year 1 profit (+$300,000) and higher assets. US GAAP shows lower Year 1 profit but no future amortization expense.
Example 2: Inventory Write-down and Reversal
Scenario: Inventory cost = 70,000. Year 2: NRV recovers to $95,000.
IFRS Treatment
| Year | Account | Debit | Credit |
|---|---|---|---|
| Year 1 | Inventory Write-down Loss | $30,000 | — |
| Inventory | — | $30,000 | |
| Year 2 | Inventory | $25,000 | — |
| Reversal of Write-down (Gain) | — | $25,000 |
Write-down reversed up to original cost
US GAAP Treatment
| Year | Account | Debit | Credit |
|---|---|---|---|
| Year 1 | Inventory Write-down Loss | $30,000 | — |
| Inventory | — | $30,000 | |
| Year 2 | (No entry) | — | — |
No reversal allowed. Inventory stays at $70,000.
Impact: IFRS shows Year 2 gain of $25,000; US GAAP shows no recovery until sale.
Example 3: Provision for Lawsuit
Scenario: Company faces lawsuit. Legal counsel estimates 55% probability of losing. Estimated loss range: 3M (equally likely).
IFRS Treatment
| Account | Debit | Credit |
|---|---|---|
| Litigation Expense | $2,000,000 | — |
| Provision for Litigation | — | $2,000,000 |
55% > 50% = “probable” under IFRS. Measurement = midpoint of range.
US GAAP Treatment
| Account | Debit | Credit |
|---|---|---|
| (No entry — disclose in footnotes only) | — | — |
55% < ~70% threshold for “probable” under US GAAP. No provision recognized; footnote disclosure only.
Impact: IFRS recognizes $2M liability and expense; US GAAP shows nothing on face of financials.
Example 4: Operating Lease (5-year term, $10,000/month)
Scenario: 5-year office lease, 500,000. Implicit rate = 5%.
Both IFRS and US GAAP — Initial Recognition
| Account | Debit | Credit |
|---|---|---|
| Right-of-Use Asset | $500,000 | — |
| Lease Liability | — | $500,000 |
Year 1 — IFRS (Single Model)
| Account | Debit | Credit |
|---|---|---|
| Depreciation Expense | $100,000 | — |
| Interest Expense | $24,000 | — |
| Right-of-Use Asset | — | $100,000 |
| Lease Liability | — | $96,000 |
| Cash | — | $120,000 |
Total Year 1 expense = $124,000 (front-loaded)
Year 1 — US GAAP (Operating Lease)
| Account | Debit | Credit |
|---|---|---|
| Lease Expense | $120,000 | — |
| Right-of-Use Asset | — | $96,000 |
| Lease Liability | — | $96,000 |
| Cash | — | $120,000 |
Total Year 1 expense = $120,000 (straight-line)
Impact: IFRS shows higher expense in early years; US GAAP shows level expense throughout.
Part 12: Conversion Impact Analysis
When a company switches from one framework to another (or maintains dual reporting), the financial impact can be significant.
Hypothetical Case: TechCorp Conversion Analysis
Background: TechCorp (US-listed) is acquiring IFRS-reporting target. Analysis of key differences:
| Item | IFRS Book Value | US GAAP Adjustment | US GAAP Book Value |
|---|---|---|---|
| Development Costs | $50M (capitalized) | -$50M (expense) | $0 |
| Inventory (LIFO Reserve) | $80M | +$12M (LIFO to FIFO) | $92M |
| PP&E (Revaluation) | $200M | -$35M (remove revaluation) | $165M |
| Provisions | $25M | -$10M (higher threshold) | $15M |
| Total Equity Impact | -$83M |
Ratio Impact Analysis
| Metric | IFRS | US GAAP | % Change |
|---|---|---|---|
| Total Assets | $1,200M | $1,117M | -6.9% |
| Total Liabilities | $700M | $690M | -1.4% |
| Shareholders’ Equity | $500M | $427M | -14.6% |
| Debt/Equity Ratio | 1.40x | 1.62x | +15.7% |
| Return on Assets | 8.3% | 8.9% | +7.2% |
| EPS (using $100M profit) | $2.00 | $1.85 | -7.5% |
Key Insight
The same underlying business looks materially different depending on the framework:
- Lower equity under US GAAP (no development capitalization, no revaluation)
- Higher leverage ratios under US GAAP
- Lower EPS in this case due to lack of development cost amortization
Analysts comparing cross-border companies must adjust for these differences.
Conversion Checklist
When converting between frameworks, focus on these high-impact areas:
| Priority | Area | Typical Direction | Magnitude |
|---|---|---|---|
| 🔴 High | Development Costs | IFRS → GAAP: Reduce equity | Could be 5-20% of R&D-heavy company’s assets |
| 🔴 High | LIFO → FIFO | GAAP → IFRS: Increase equity | Depends on LIFO reserve (disclosed in footnotes) |
| 🔴 High | Provisions | IFRS → GAAP: Reduce liabilities | Variable; review each contingency |
| 🟡 Medium | PP&E Revaluation | IFRS → GAAP: Reduce equity | Significant for asset-heavy industries |
| 🟡 Medium | Impairment Reversal | IFRS → GAAP: May reduce equity | Depends on historical reversals |
| 🟢 Low | Lease Classification | Affects P&L pattern, not total | Timing difference only |
Part 13: The Data & Analyst Perspective (IPO Edition)
In an IPO scenario, the friction isn’t just about accounting entries; it’s about Data Integrity and Scalability. For Data Analysts and FP&A professionals building automated dashboards or S-1 registration statements, dual reporting creates unique technical nightmares.
13.1 The “Excel Wall” vs. Automated Pipelines
Data analysts crave automation. But IFRS/GAAP conversions often happen outside the system.
The Ideal World:
Raw Data (ERP) → ETL Pipeline → Data Warehouse → Power BI Dashboard

The Dual-Reporting Reality:
Raw Data (ERP: US GAAP) → [Excel Black Box: Top-side Adjustments] → Manual Upload → Report| Layer | What Happens |
|---|---|
| ERP System | Usually stores only one set of books (typically local GAAP) |
| Conversion Layer | IFRS adjustments (Top-side Adjustments) are done manually in Excel or consolidation software (Hyperion/OneStream) |
| Analyst Pain | When pulling “real-time” data from the database, numbers never match the published financials (missing the Excel adjustment layer) |
IPO Impact: Audit Trail Fragmentation
During due diligence, when auditors request “Show me the source data for 3 years of IFRS revenue detail,” analysts cannot provide a clean SQL query. Instead, they deliver a patchwork of Excel files stitched together. This is the dreaded “Audit Trail Fragmentation”.
13.2 KPI Definitions & Dashboard Logic
For analysts maintaining BI dashboards, even a simple KPI becomes a conditional logic nightmare.
Scenario: Build an automated EBITDA Margin dashboard.
-- The Code Nightmare (SQL/DAX)
CASE
    WHEN Reporting_Standard = 'US_GAAP' THEN
        Revenue - Rent_Expense_Straight_Line - Other_OpEx
    WHEN Reporting_Standard = 'IFRS' THEN
        Revenue - Depreciation_ROU - Interest_Lease - Other_OpEx
END AS EBITDA
IPO Impact: Historical Data Archaeology
Investor roadshow decks require “3-year trends.” If the company wasn’t tracking lease interest components separately 3 years ago (because it only ran US GAAP), analysts must perform Historical Data Reconstruction—manually rebuilding data that was never captured. This is the primary cause of all-nighters before IPO.
13.3 Pro Forma Financials
IPOs often require Pro Forma Statements—as if the company had always operated under the new structure.
| Challenge | Description |
|---|---|
| The Ask | Convert a US GAAP private company to IFRS public company standards, retrospectively for 3 years |
| The Problem | It’s not just reclassification—it’s Data Granularity gaps |
| Example | Under US GAAP, all R&D was expensed together. Under IFRS, you need to split “Research” vs “Development.” If the old system had no such tag, analysts must review every historical invoice manually |
| Result | The data team becomes a “Human ETL”—spending 80% of time cleaning/aligning data, only 20% on actual analysis |
Part 14: Beyond Finance — The Cross-Functional Ripple Effect
Accounting standards don’t stay in the finance department. They dictate how other teams structure deals, manage systems, and handle legal risks.
| Department | The Friction Point | The Typical Question |
|---|---|---|
| Legal | Provisions threshold (50% vs 75%) | “Why do we have to book a $1M loss before we’ve even lost the case?” (IFRS) |
| HR / Compensation | EBITDA-based bonuses | ”Why is my bonus different depending on which accounting book we use?” |
| Sales | Contract terms (buyback clauses) | “Why does Accounting say my ‘Guaranteed Buyback’ clause killed the revenue?” |
| IT | ERP configuration & parallel ledgers | ”You want the system to calculate inventory cost how many different ways?“ |
14.1 Legal: The “50% vs. 75%” Fight
Scenario: Company faces a patent lawsuit. Legal counsel estimates 60% probability of losing, with $1M estimated damages.
| Framework | Threshold | Result | Legal’s Reaction |
|---|---|---|---|
| US GAAP | ~70-75% “probable” | 60% < 75% → No provision. Disclosure only. | Happy 😊 — no admission of likely loss |
| IFRS | >50% “more likely than not” | 60% > 50% → Book $1M liability immediately | Furious 😤 — “We haven’t even lost yet!” |
The conflict: Under IFRS, booking a provision may be used by opposing counsel as leverage in settlement negotiations.
14.2 HR: The Bonus Trap
Scenario: Sales bonus tied to EBITDA achievement.
| Framework | Lease Treatment | EBITDA Impact |
|---|---|---|
| IFRS | Depreciation + Interest (below EBITDA line) | Higher EBITDA |
| US GAAP | Straight-line Rent Expense (above EBITDA line) | Lower EBITDA |
If HQ sets targets using IFRS but the US subsidiary calculates bonuses on US GAAP, American employees will feel their targets are unfairly hard—or the company may overpay bonuses inadvertently.
14.3 IT: The System Architecture Nightmare
Scenario: Company decides to list in Europe, requiring dual reporting.
| IT Challenge | Description |
|---|---|
| Parallel Ledgers | SAP/Oracle must run two sets of books |
| Asset Componentization | Same machine: US GAAP = 10-year depreciation; IFRS = motor (5 years) + chassis (15 years) separately |
| Maintenance Burden | Two Fixed Asset Master Data files; double UAT testing for every system upgrade |
Part 15: The Operational Reality — How It Feels on the Ground
For Controllers and Accounting Managers, differences aren’t theoretical—they’re daily friction.
15.1 The R&D “Interrogation”
| Step | US GAAP | IFRS |
|---|---|---|
| Invoice arrives: $50K prototype | Code to “R&D Expense.” Done. | Cannot expense immediately. |
| Required action | — | Call Project Manager: “Is this Research or Development phase? Technical feasibility established? Future economic benefits proven?” |
| Day-to-day impact | Minimal | Must track engineering timesheets, project milestones, and maintain documentation for each capitalization decision |
15.2 The “Month-End” Sprint (Double Close)
Dual-reporting entities often run a “Double Close”:
Day 1-3: Close books under US GAAP (local tax compliance)
    ↓
Day 4-5: Calculate and post Top-side Adjustments
    ↓
Day 6: Convert to IFRS for parent company consolidation
What gets adjusted?
- LIFO Reserve calculations
- Lease reclassification (operating → finance-like)
- Reverse provisions that don’t meet IFRS threshold
- Reclassify development costs from expense to asset
Impact: Month-end close extends by 2-3 days. The finance team runs on caffeine during the first week of every month.
15.3 The FP&A Confusion (Bridge Decks Everywhere)
Scenario: Monthly business review meeting.
| Issue | What Happens |
|---|---|
| Budget Basis | Set by HQ using IFRS |
| Actual Numbers | US subsidiary runs US GAAP |
| Variance Explanation | FP&A spends hours building “Bridge Decks” explaining why GAAP profit ≠ IFRS profit |
Typical explanation:
“Boss, US revenue looks down, but it’s actually the lease treatment difference. Also, that software project was expensed under GAAP but would be capitalized under IFRS, so if we adjust for that…”
Result: FP&A spends more time on reconciliation than actual business analysis.
Part 16: The Philosophy Behind the Rules — Battlefield Examples
Understanding the “what” is not enough. To truly master these frameworks, you must understand the “why” behind each design choice.
16.1 The LIFO Battlefield
The most classic example of the Rules vs. Principles divide is LIFO (Last-In, First-Out).
Scenario: You sell oil. Prices are rising. Your warehouse has one barrel bought at 100 (new). You sell one barrel today. Which cost do you use?
| Framework | Treatment | Logic |
|---|---|---|
| US GAAP | You can assume you sold the $100 barrel (LIFO) | This reduces profit and saves taxes. It’s the result of powerful tax lobbying tied to the IRS LIFO Conformity Rule. |
| IFRS | Strictly prohibited | LIFO violates physical reality. Except for coal piles, no business truly sells newest inventory first while old inventory rots. |
The Hidden Cost of LIFO
Your Balance Sheet becomes severely distorted. The “inventory” line shows decades-old prices that bear no resemblance to current value. LIFO trades balance sheet integrity for income statement tax benefits.
Structural Insight:
- GAAP sometimes compromises logic for real-world benefits (taxes, politics)
- IFRS has a “purist obsession” with economic substance, even at the cost of tax disadvantages
16.2 The Philosophy of “Second Chances”: Impairment Reversal
This reveals the two frameworks’ trust in human judgment.
Scenario: You own land. It dropped in value, so you recorded an impairment loss. Two years later, land prices recover.
| Framework | Treatment | Logic |
|---|---|---|
| IFRS | ✅ Allows reversal | If value recovered, the financial statements should reflect reality. |
| US GAAP | ❌ Prohibits reversal | Once impaired, it’s impaired forever. If it recovers, you’ll realize the gain when you sell. |
The Philosophical Divide:
| IFRS (The Idealist) | US GAAP (The Cynic) |
|---|---|
| “Give people guidance, and they’ll make honest judgments." | "People lie. Block the exit.” |
| Relies on professional judgment | Assumes management will manipulate |
| Risk: Earnings manipulation (“our assets magically recovered!”) | Risk: Overly conservative, hides true value |
Structural Insight: IFRS trusts professionals with flexibility. GAAP prefers to close the door rather than risk abuse.
16.3 The View of “Innovation”: R&D Treatment
This directly affects how we evaluate technology companies.
Scenario: A pharma company spends $1 billion on R&D.
| Framework | Treatment | Result |
|---|---|---|
| US GAAP | Expense immediately | Low profit, low assets. The logic: R&D has high failure rates—until success, it’s “burned money.” |
| IFRS | Split into Research (expense) + Development (capitalize after feasibility) | Higher profit during development phase. Balance sheet shows an “Intangible Asset.” |
The “Lens Effect” on Analysis:
Same Company, Two Lenses:

┌─────────────────────────────────────────────────────────┐
│ US GAAP Lens (Amazon 2000):                             │
│   Revenue: $2.7B  |  Net Loss: -$1.4B                   │
│   → "This company is burning cash. It's dying."         │
├─────────────────────────────────────────────────────────┤
│ IFRS Lens (hypothetical):                               │
│   Revenue: $2.7B  |  Development Asset: +$800M          │
│   → "This company is building massive future value."    │
└─────────────────────────────────────────────────────────┘
Cross-Border Analysis Warning
When comparing a European automaker (IFRS) with an American automaker (GAAP):
- The European company’s assets look inflated (capitalized development)
- The American company’s profits look depressed (all R&D expensed)
This isn’t who’s running better—it’s the ruler that’s different.
Structural Insight:
- GAAP hides potential value in expenses (conservative, but undervalues innovation)
- IFRS tries to surface future potential, but requires accountants to write quarterly reports justifying “why we believe this asset will generate returns”
Summary: Quick Reference Table
| Area | Key IFRS vs US GAAP Difference |
|---|---|
| LIFO | IFRS prohibits; GAAP allows |
| Impairment Reversal | IFRS allows (except goodwill); GAAP prohibits |
| Development Costs | IFRS capitalizes; GAAP expenses |
| Revaluation | IFRS allows; GAAP prohibits |
| Provisions | IFRS: >50% = recognize; GAAP: ~70%+ = recognize |
| Leases (Lessee) | IFRS: single model; GAAP: dual model |
| Interest/Dividends Cash Flow | IFRS: flexible; GAAP: fixed classification |
| DTA Recognition | IFRS: probability-limited; GAAP: full + allowance |
Conclusion
IFRS and US GAAP share common ancestry but have evolved differently. The philosophical divide (principles vs. rules) manifests in hundreds of technical differences that can materially affect reported numbers.
For companies operating across borders, understanding these differences isn’t academic—it’s essential for accurate reporting, valuation, and compliance. While convergence efforts have aligned major areas like revenue recognition, significant gaps remain in inventory, leases, impairment, and taxes.
The path forward is not full unification, but rather informed navigation of both frameworks.